CMIP6 historical (1985-2014) wrt ERA5/GPCP (1985-2014)
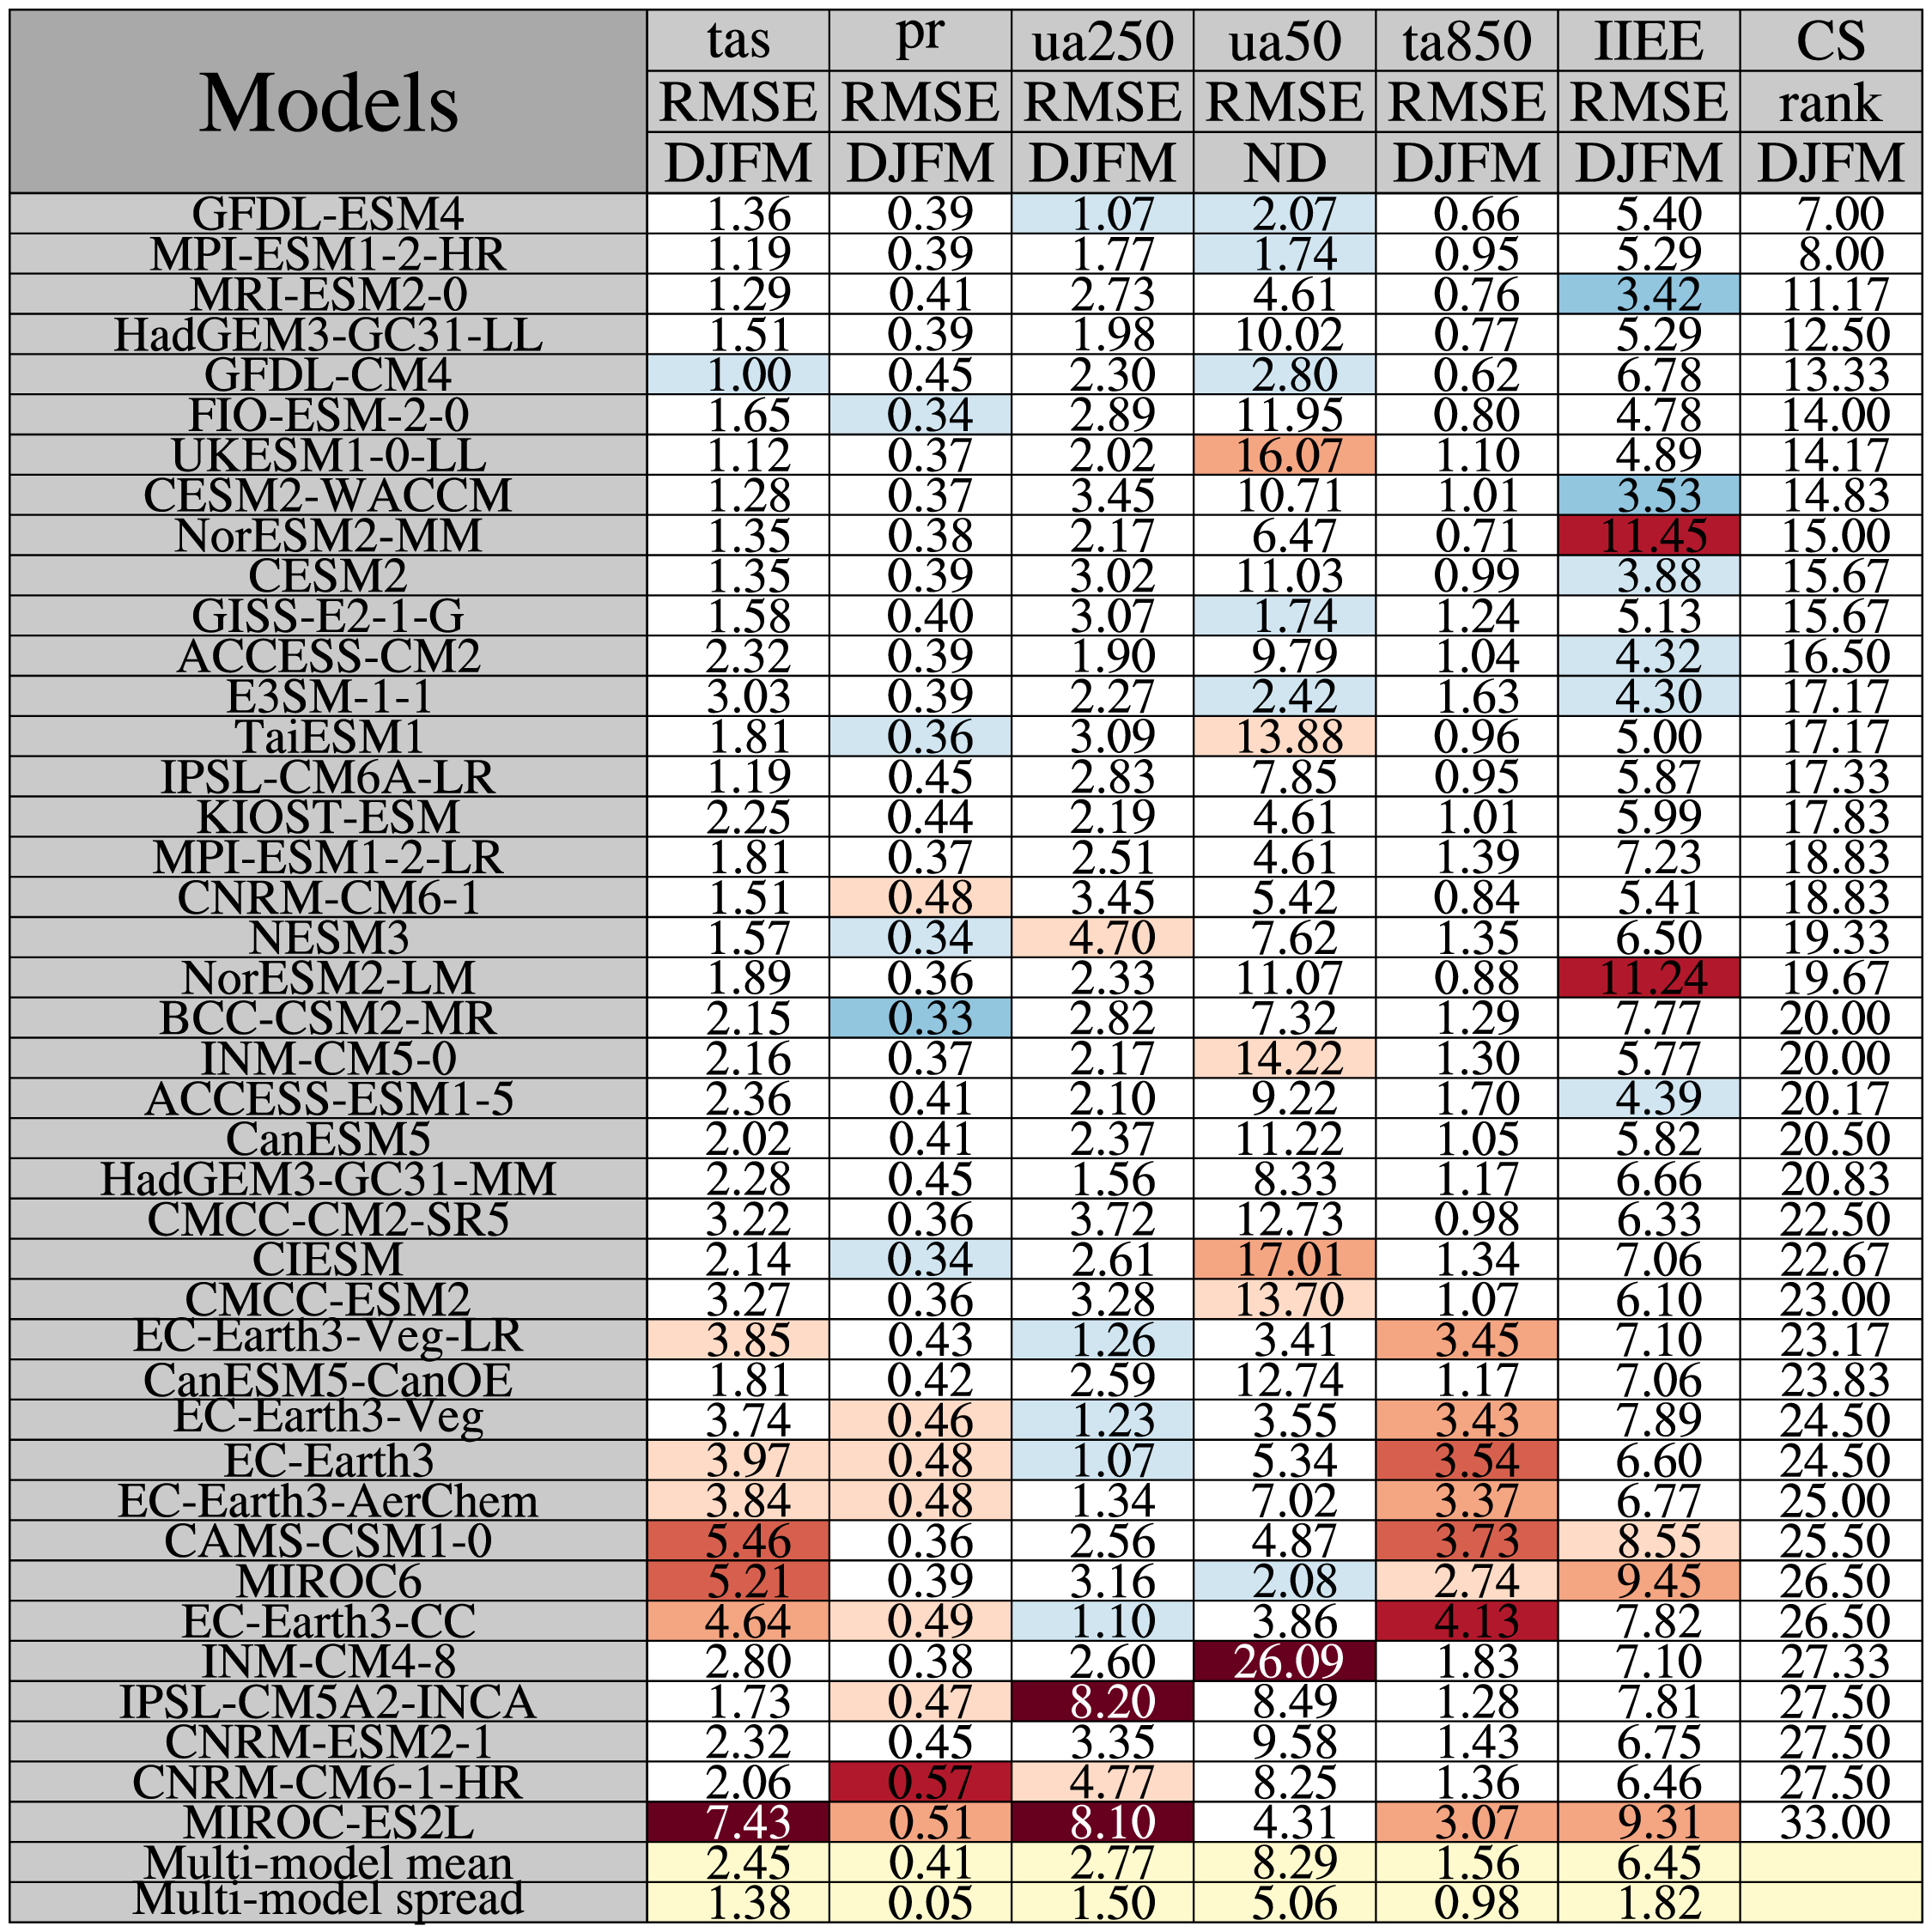
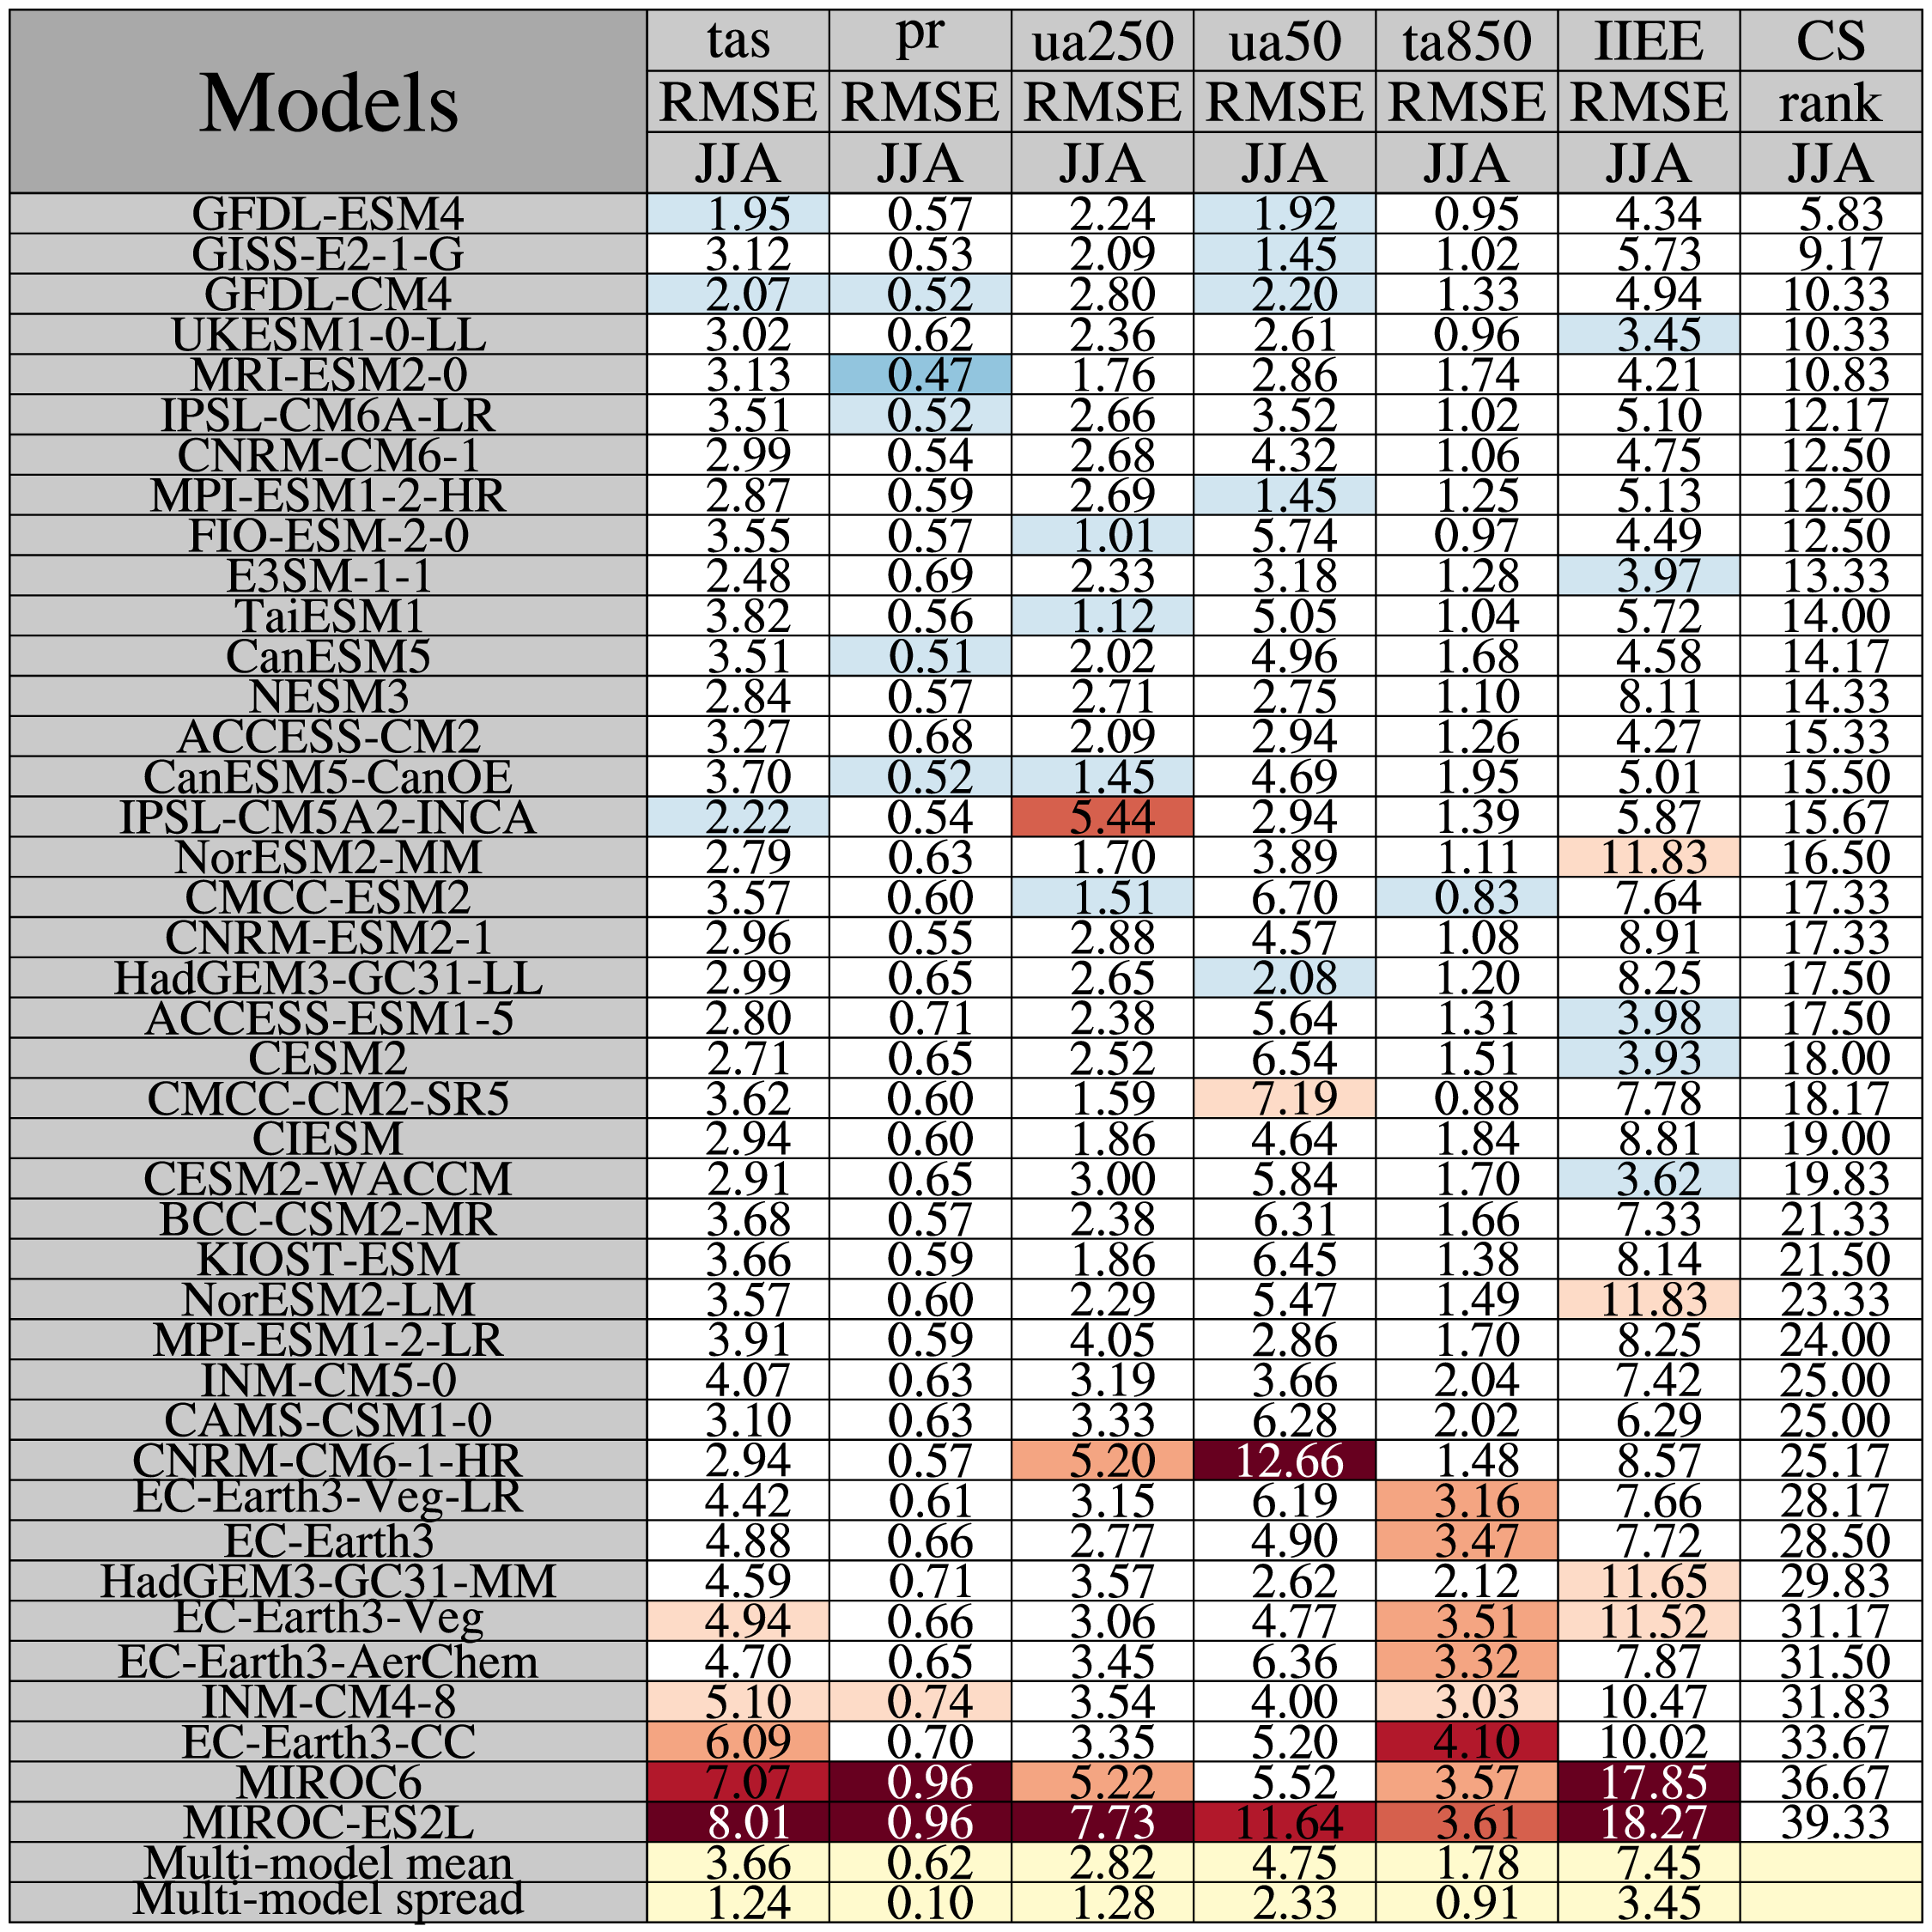
The tables show the area-averaged root-mean-square error (RMSE) for 2-m temperature (tas), total large-scale and convective precipitation (pr), 850-hPa zonal wind (ua850), 50-hPa zonal wind (ua50), 850-hPa temperature (ta850), and the integrated ice-edge error (IIEE) for each of the CMIP6 models with respect to relevant reference dataset (ERA5 or GPCP). The scores are computed using time-averaged fields (not trends). Note that for DJFM, ua50 is taken for November-December (ND) only in line with the SH storylines predictors.
For ta850 and ua850, values below topography are filtered out using the surface pressure field to make the results as consistent as possible between the models. The reason for this is that not all models provide extrapolated below the surface for the air temperature (ta) field.
Values are area-averaged for the Antarctic (latitudes south of 50S).
As in the Southern Hemisphere storylines regression anaysis, only a single member is used for each model (mostly member r1i1p1f1).
Numbers with light yellow background are multi-model values: the multi-model mean and the multi-model spread (in terms of the standard deviation).
Red/blue background indicate that the RMSE/bias/correlation values differ from the multi-model values by more than one one standard deviation, with red indicating that the values exceed the multi-model mean by one standard deviation more more and blue indicates that the values are too small by one standard deviation or more. The larger the discrepancy with respect to the multi-model values, the darker the colors.
The rightmost column shows a measure of the overall performance for each model, here defined as the average rank for the four fields investigated, the model with the lowest ranking number is considered the best.
To compute the climatology score, the models are ranked for each variable. The model with the lowest RMSE value is considered the best/highest-ranking model and recives the ranking number 1, the second best model reciving the ranking number 2, etc. Then for each model, the average rank is computed across the variables and then the models are sorted with the allover highest ranking model (with the lowest ranking number) being placed on top.