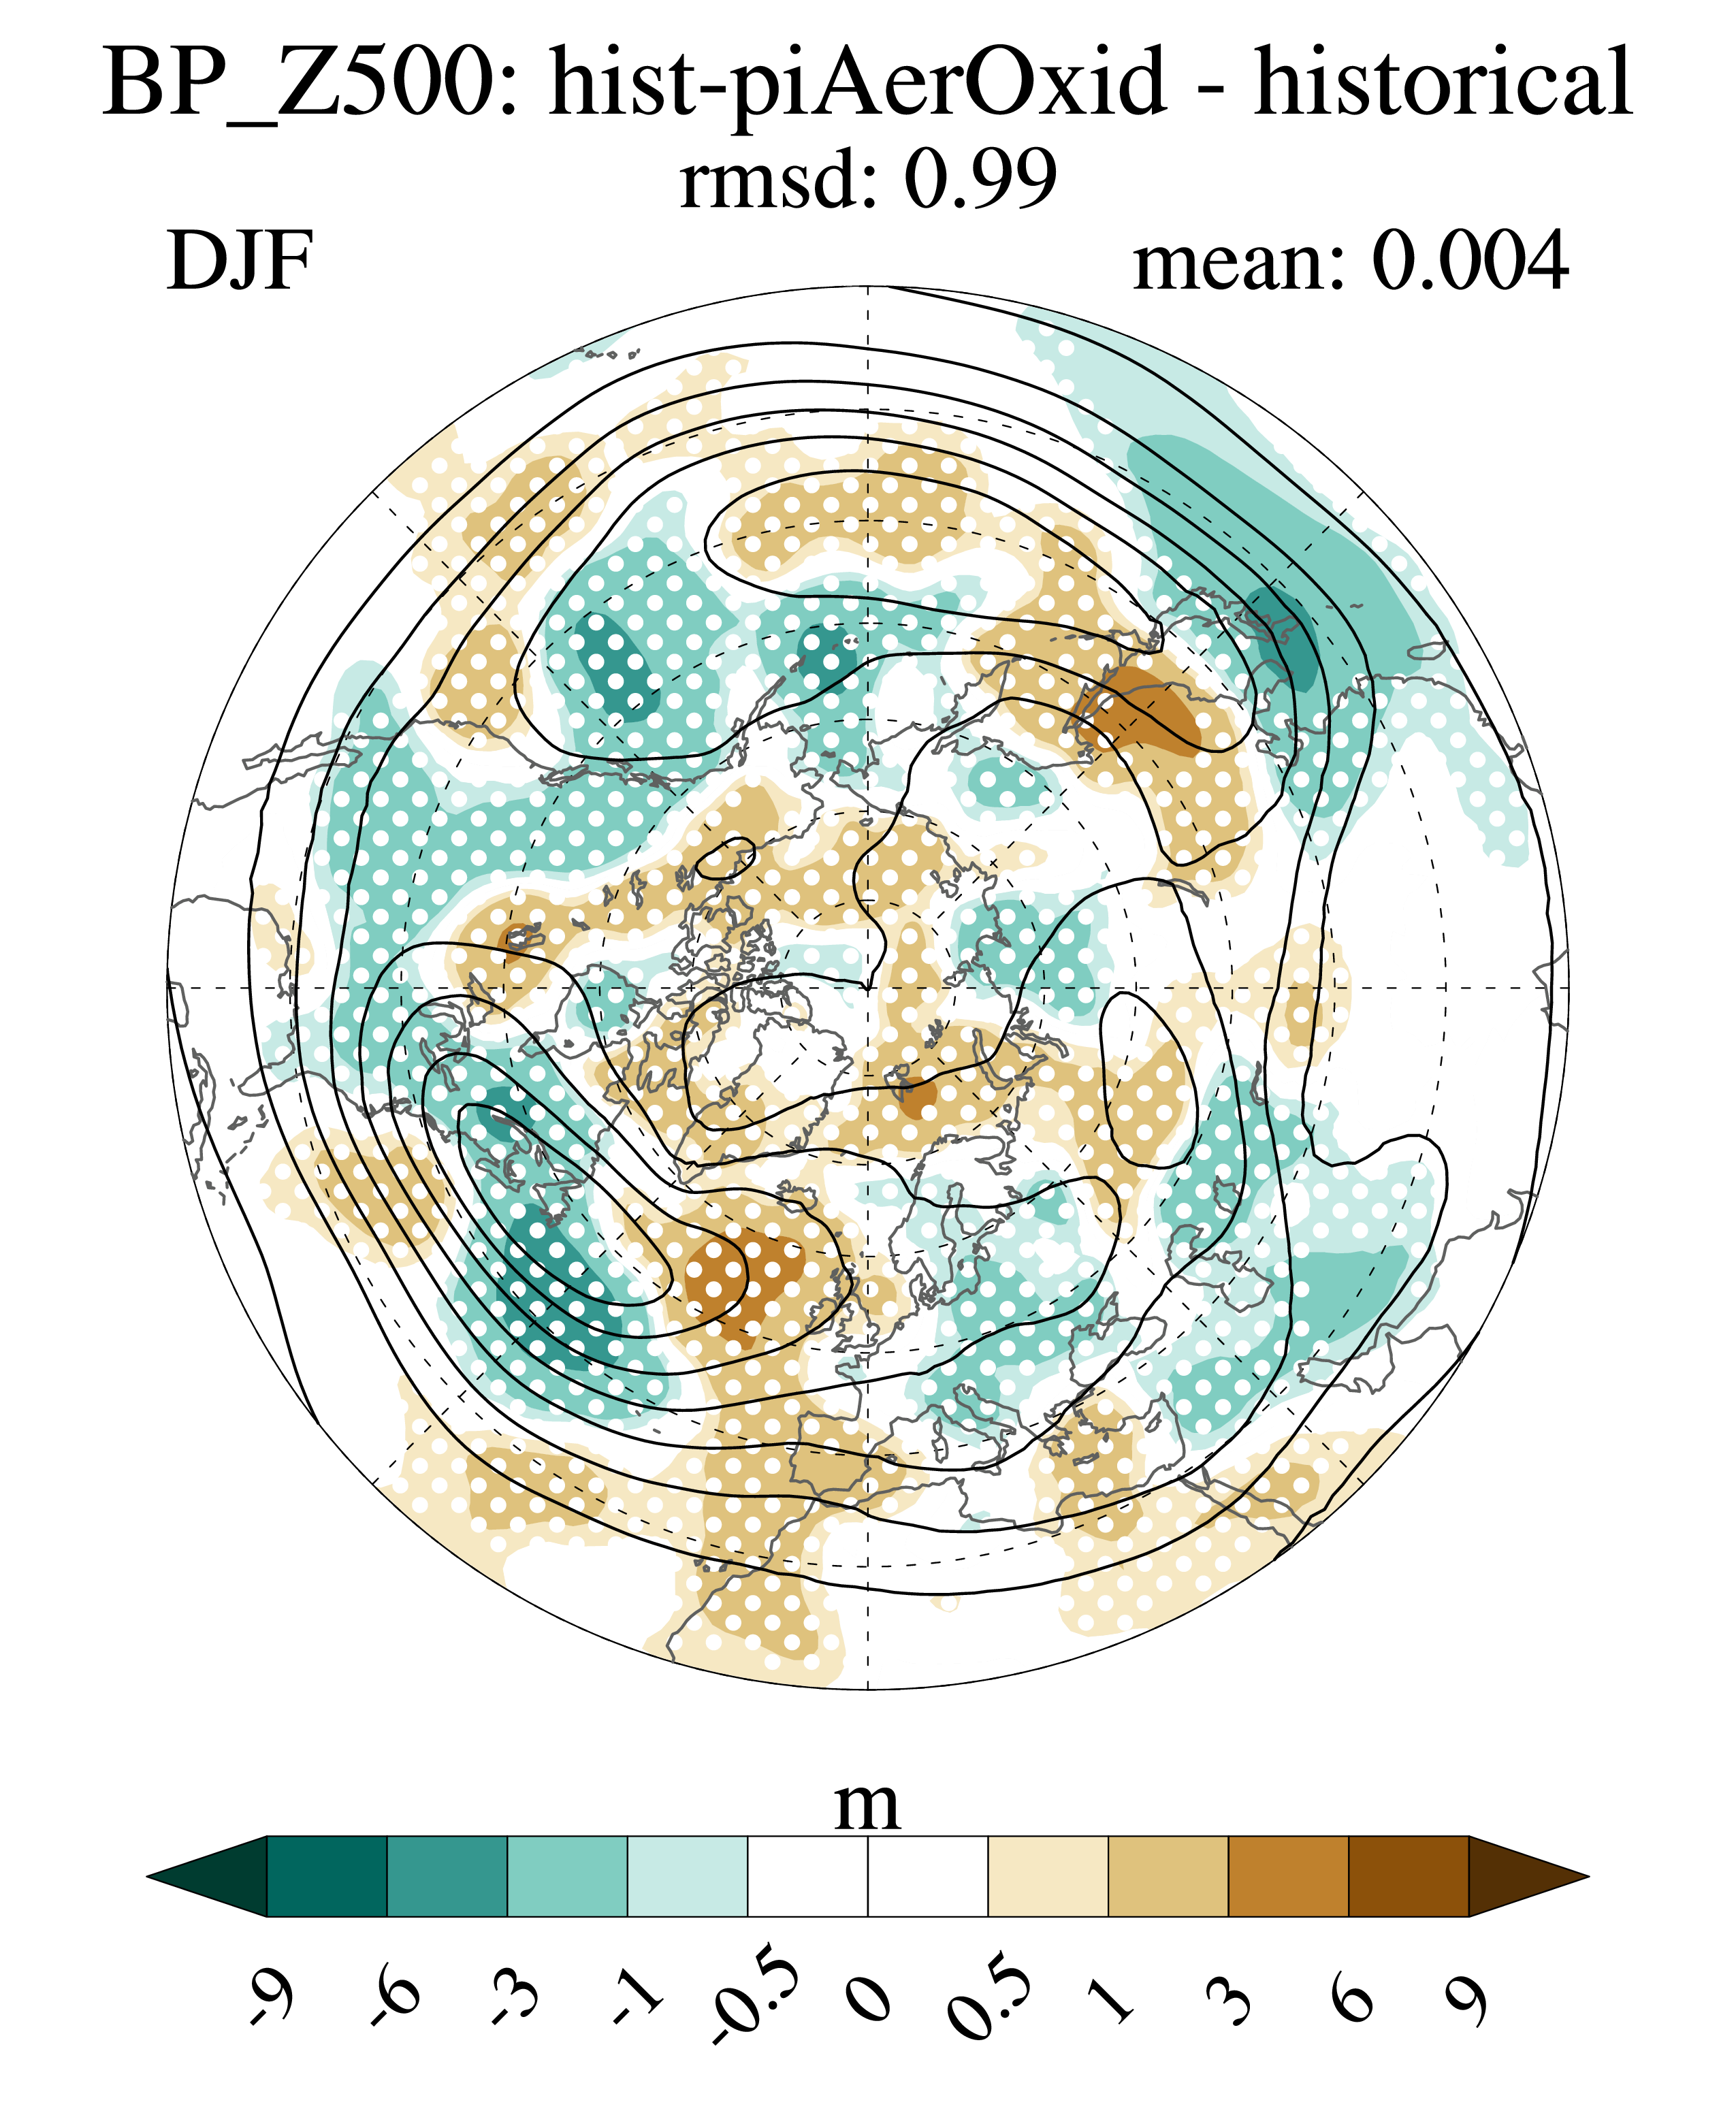
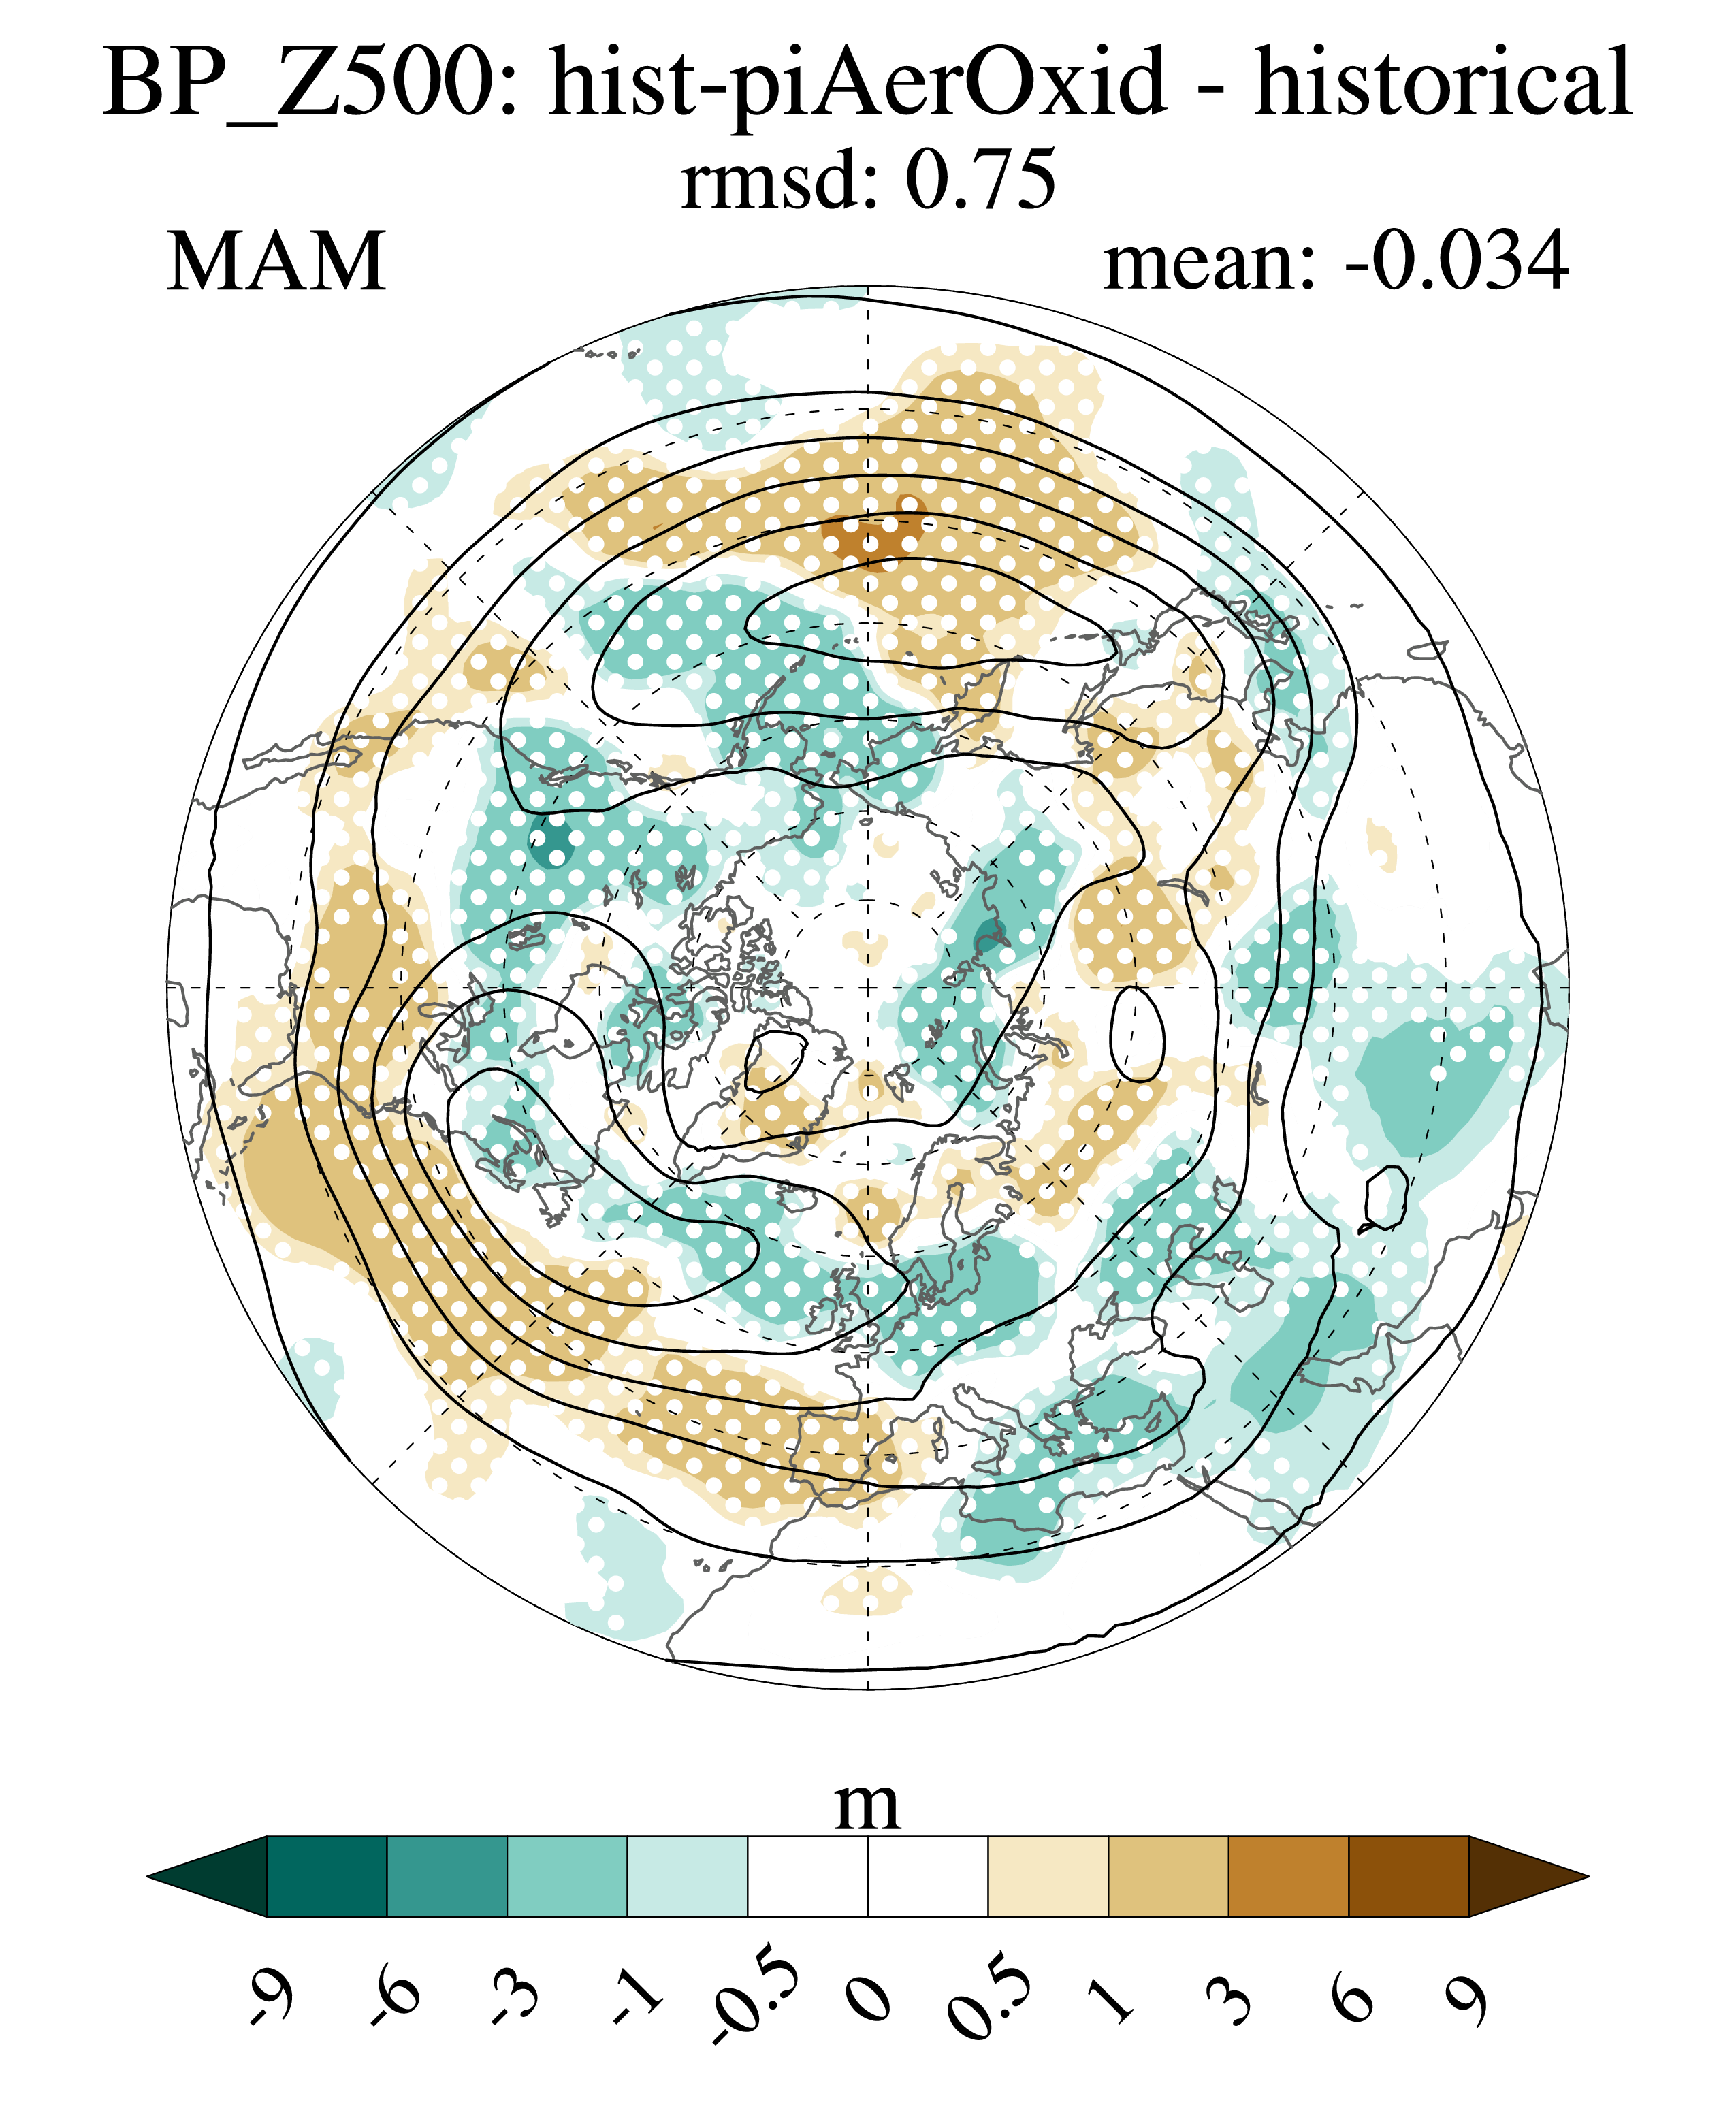
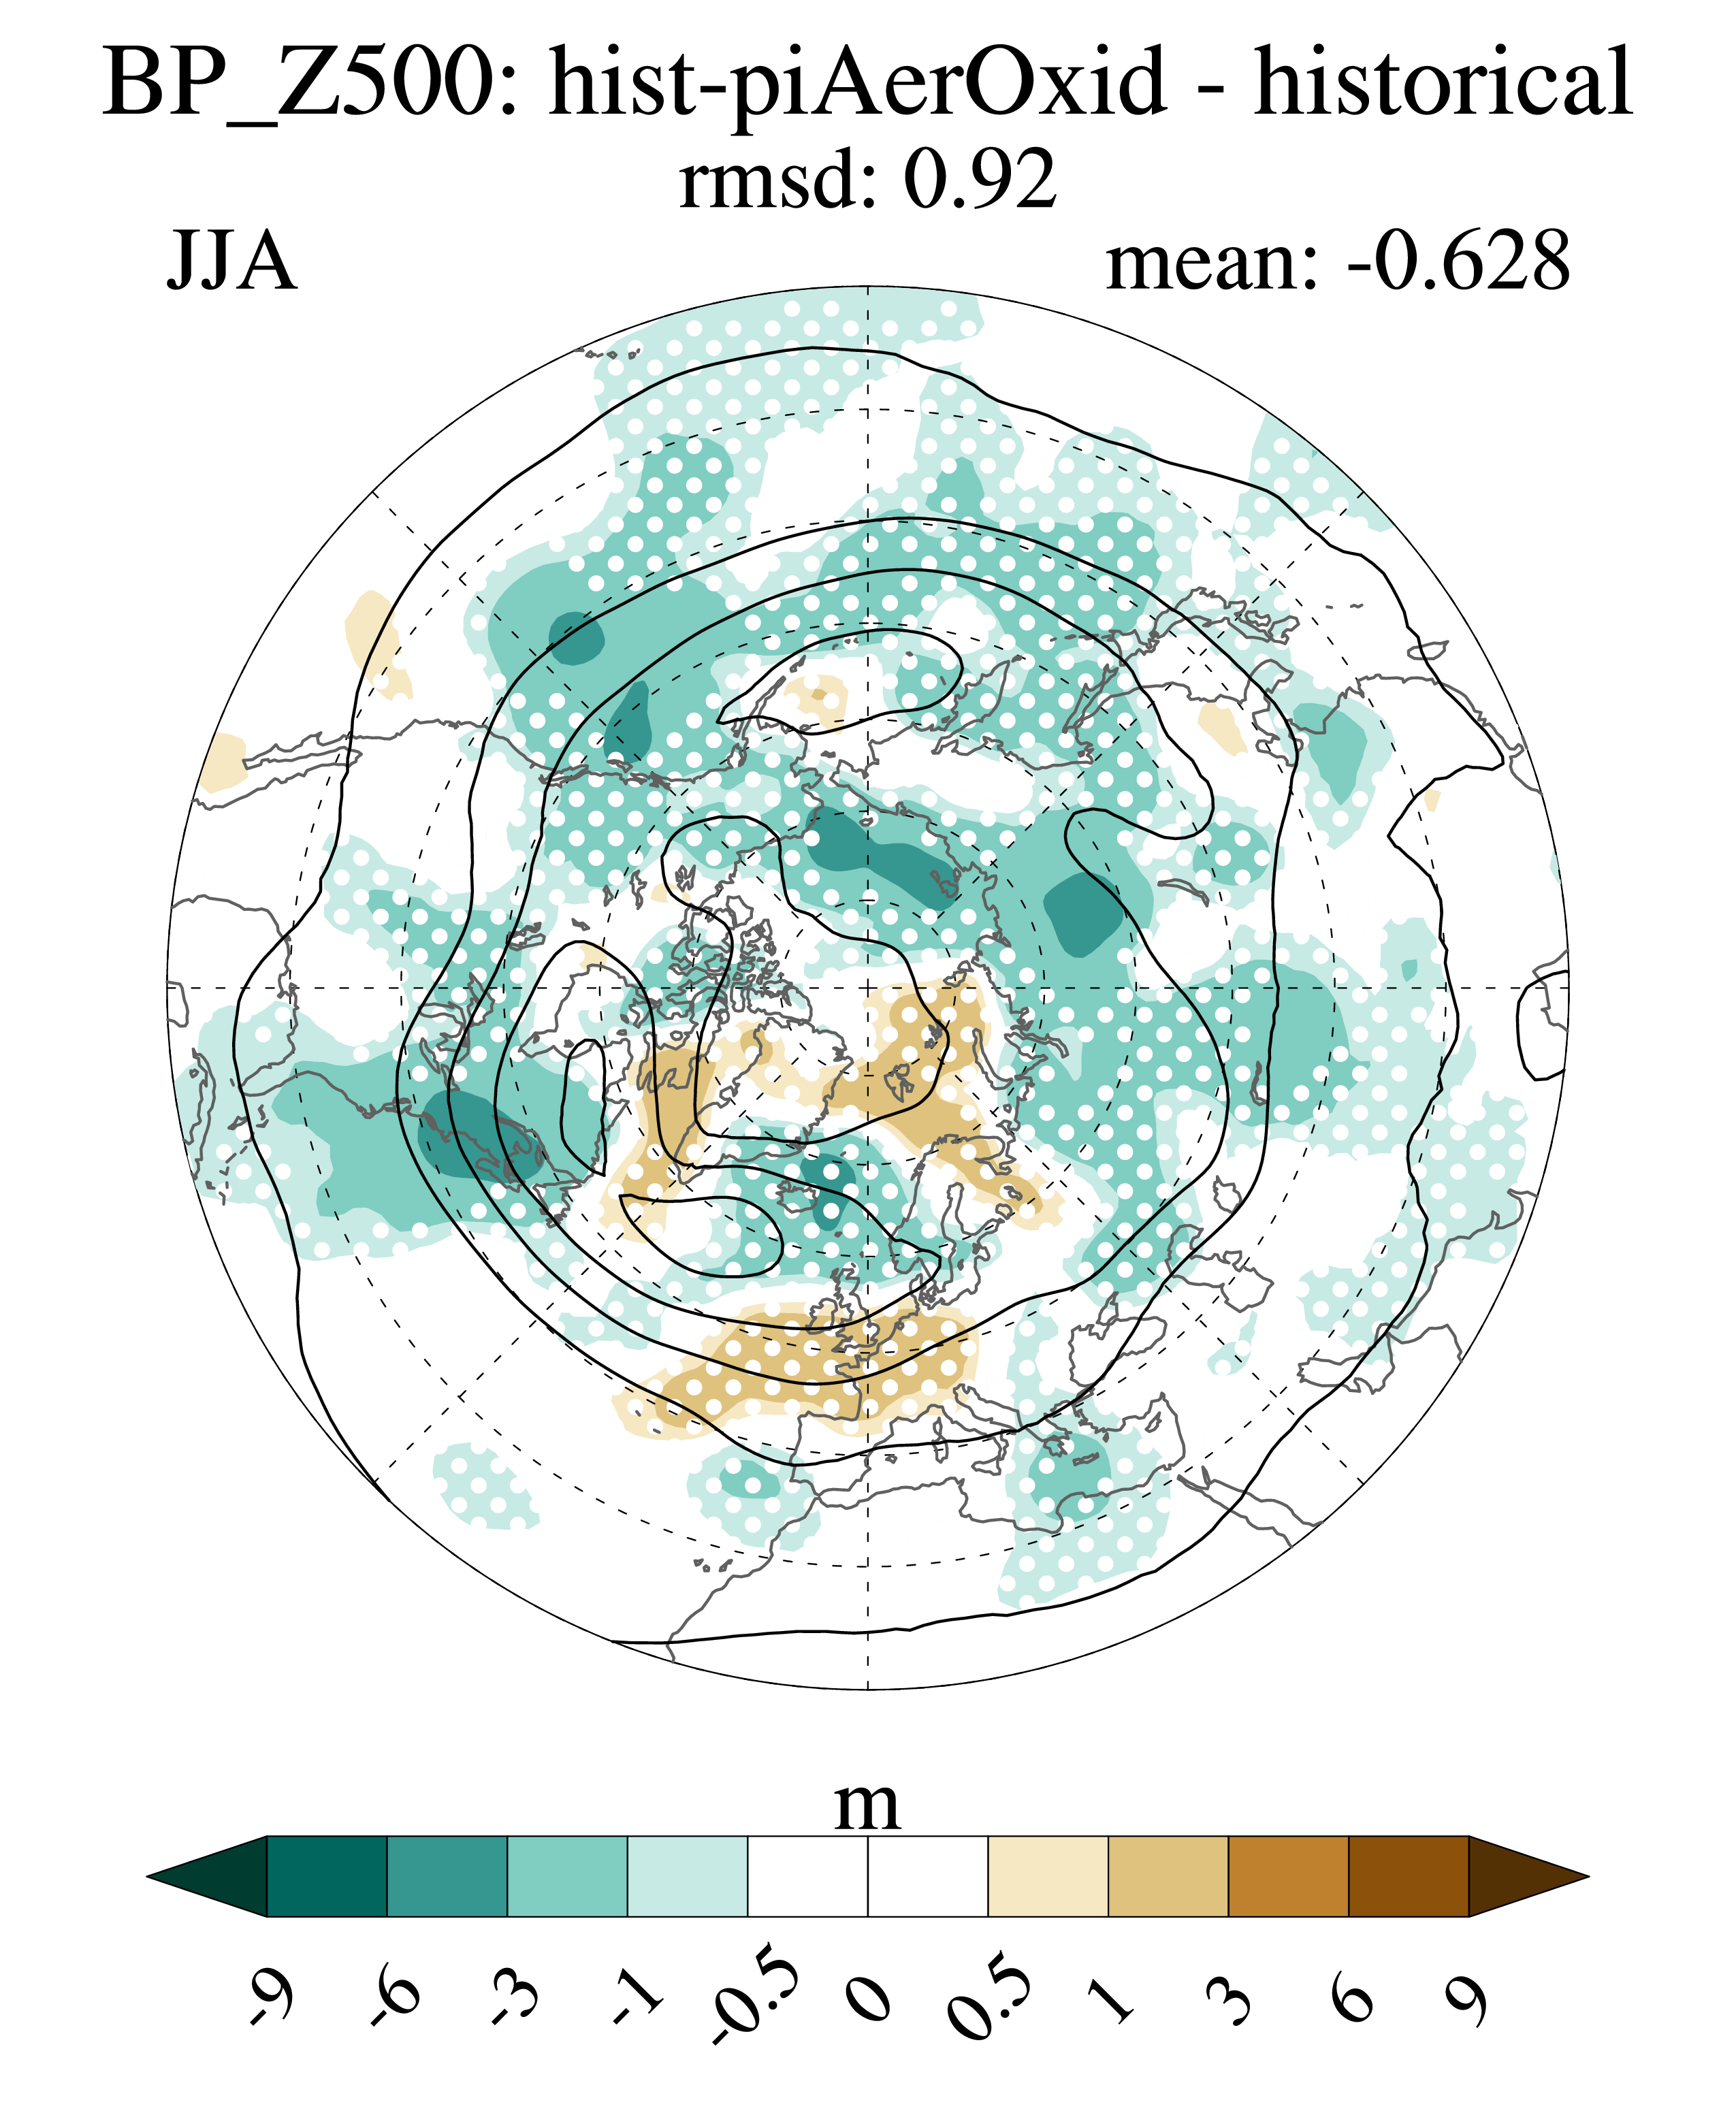
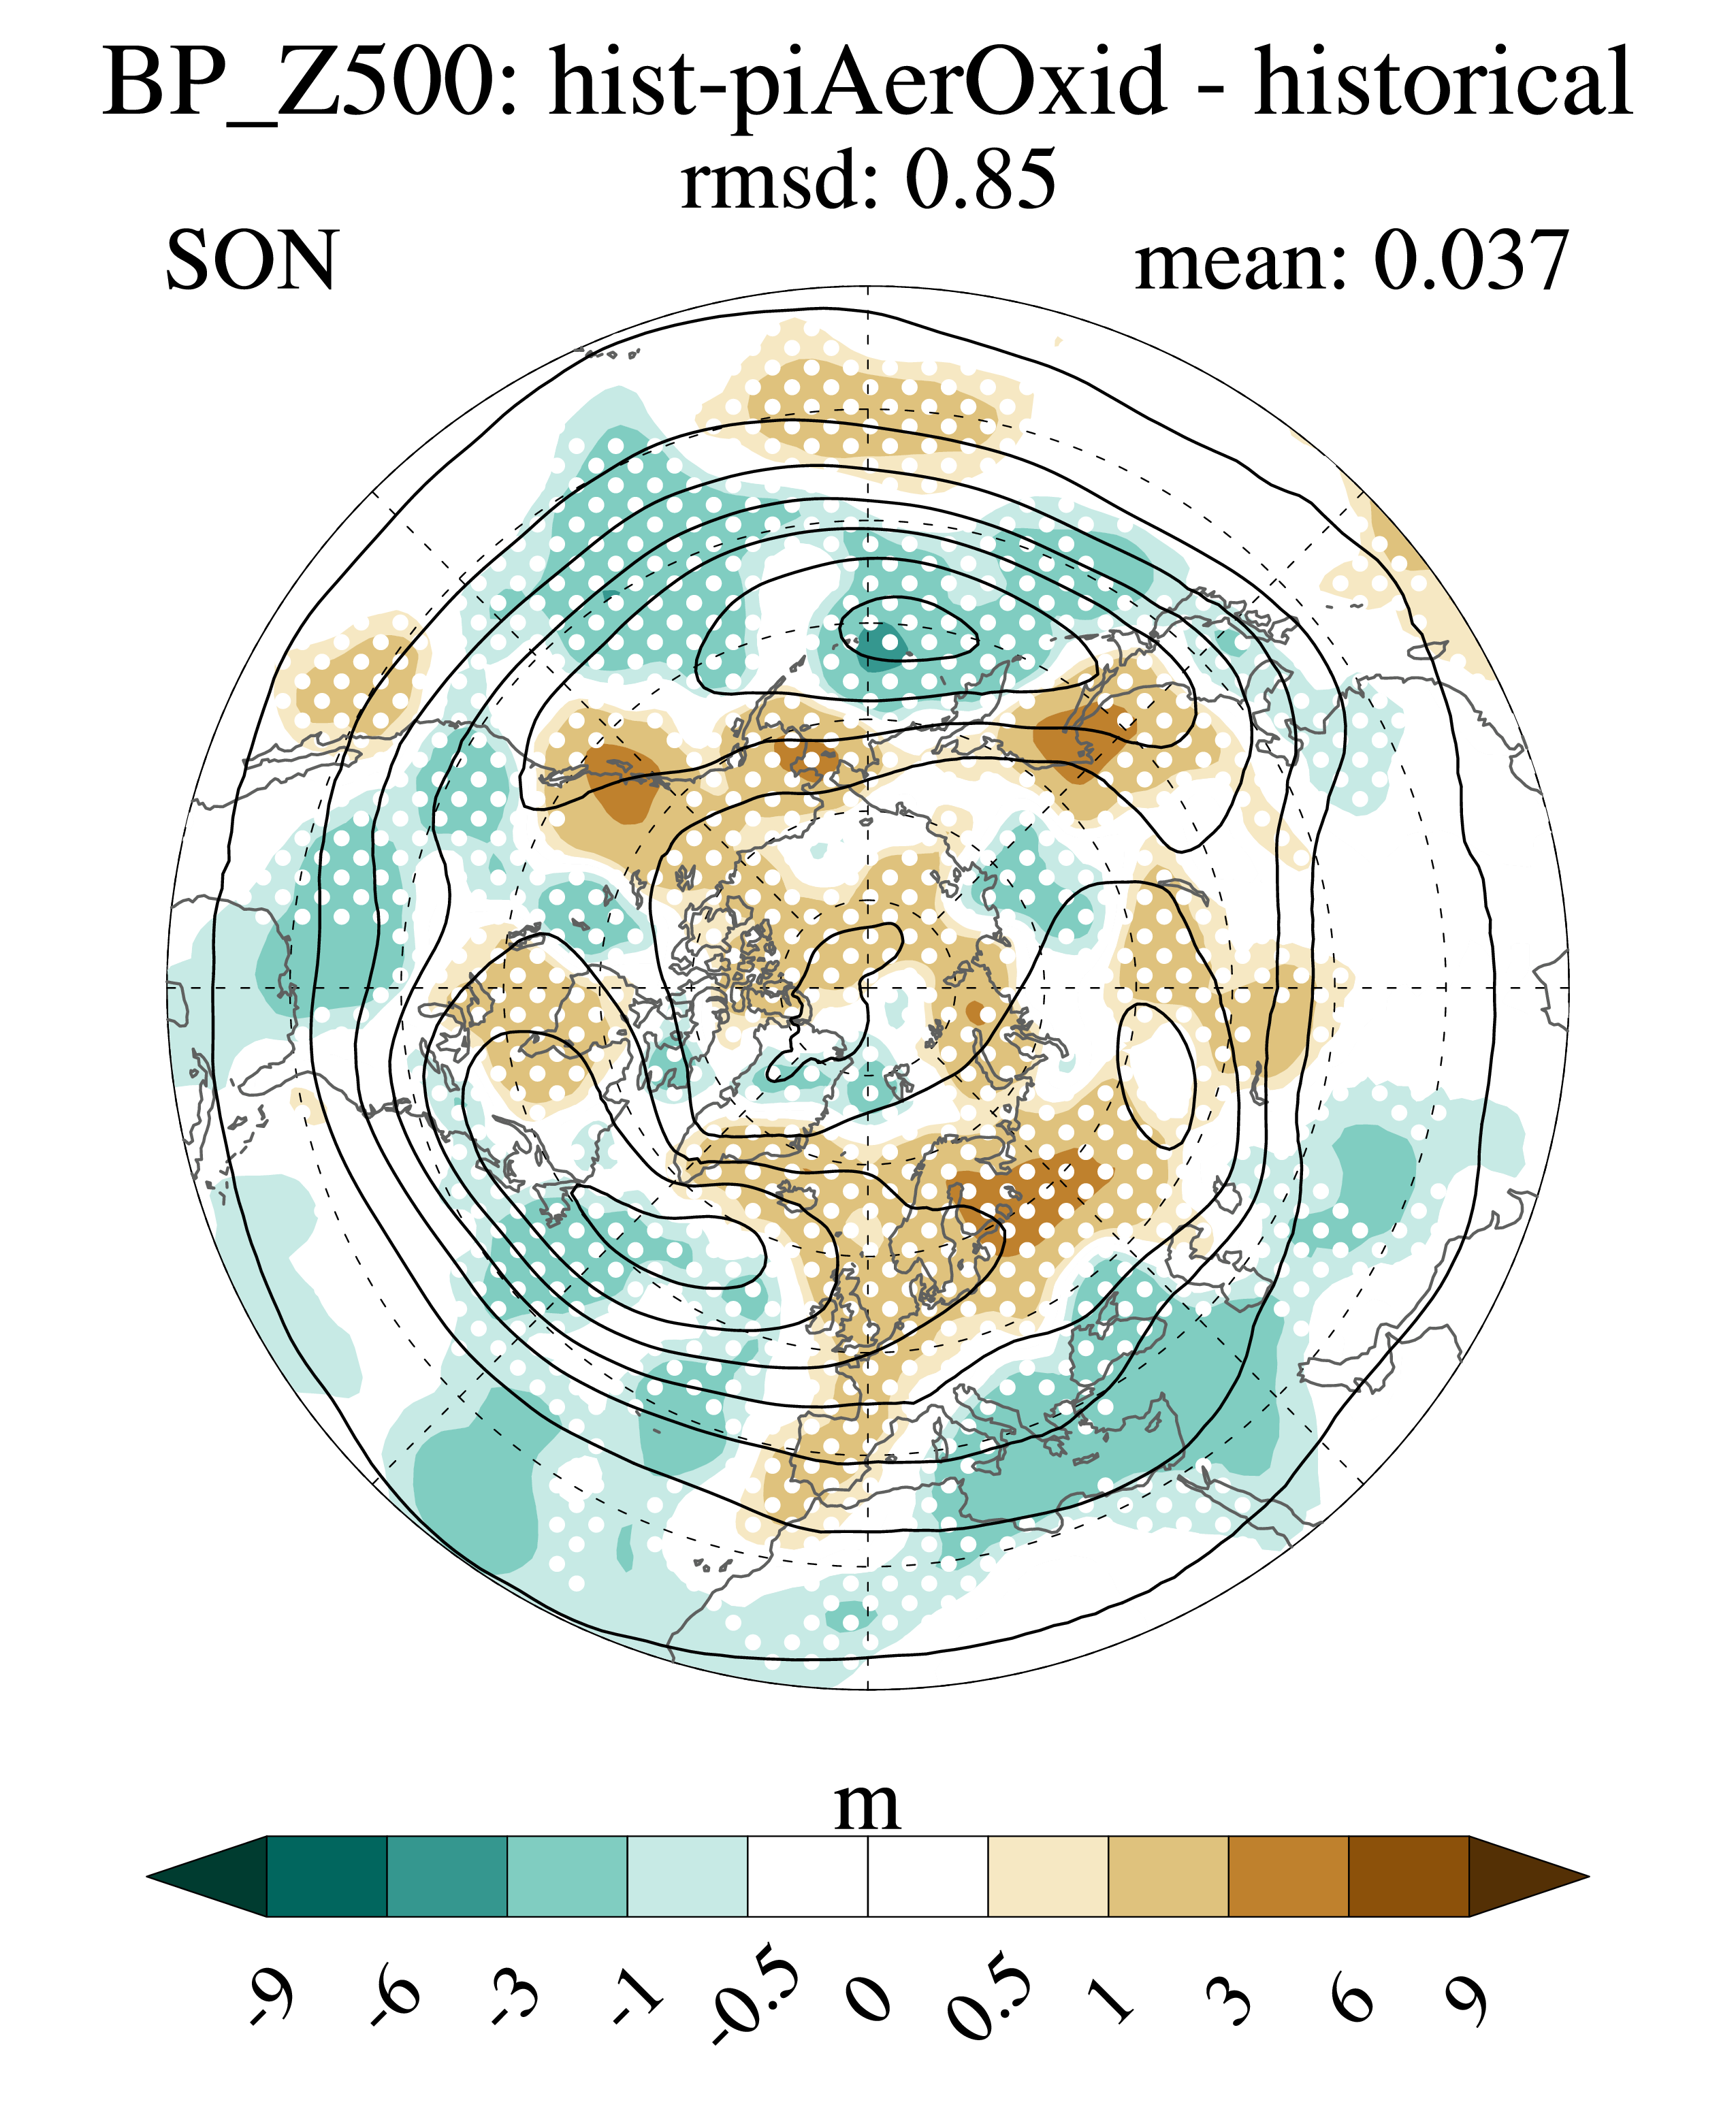
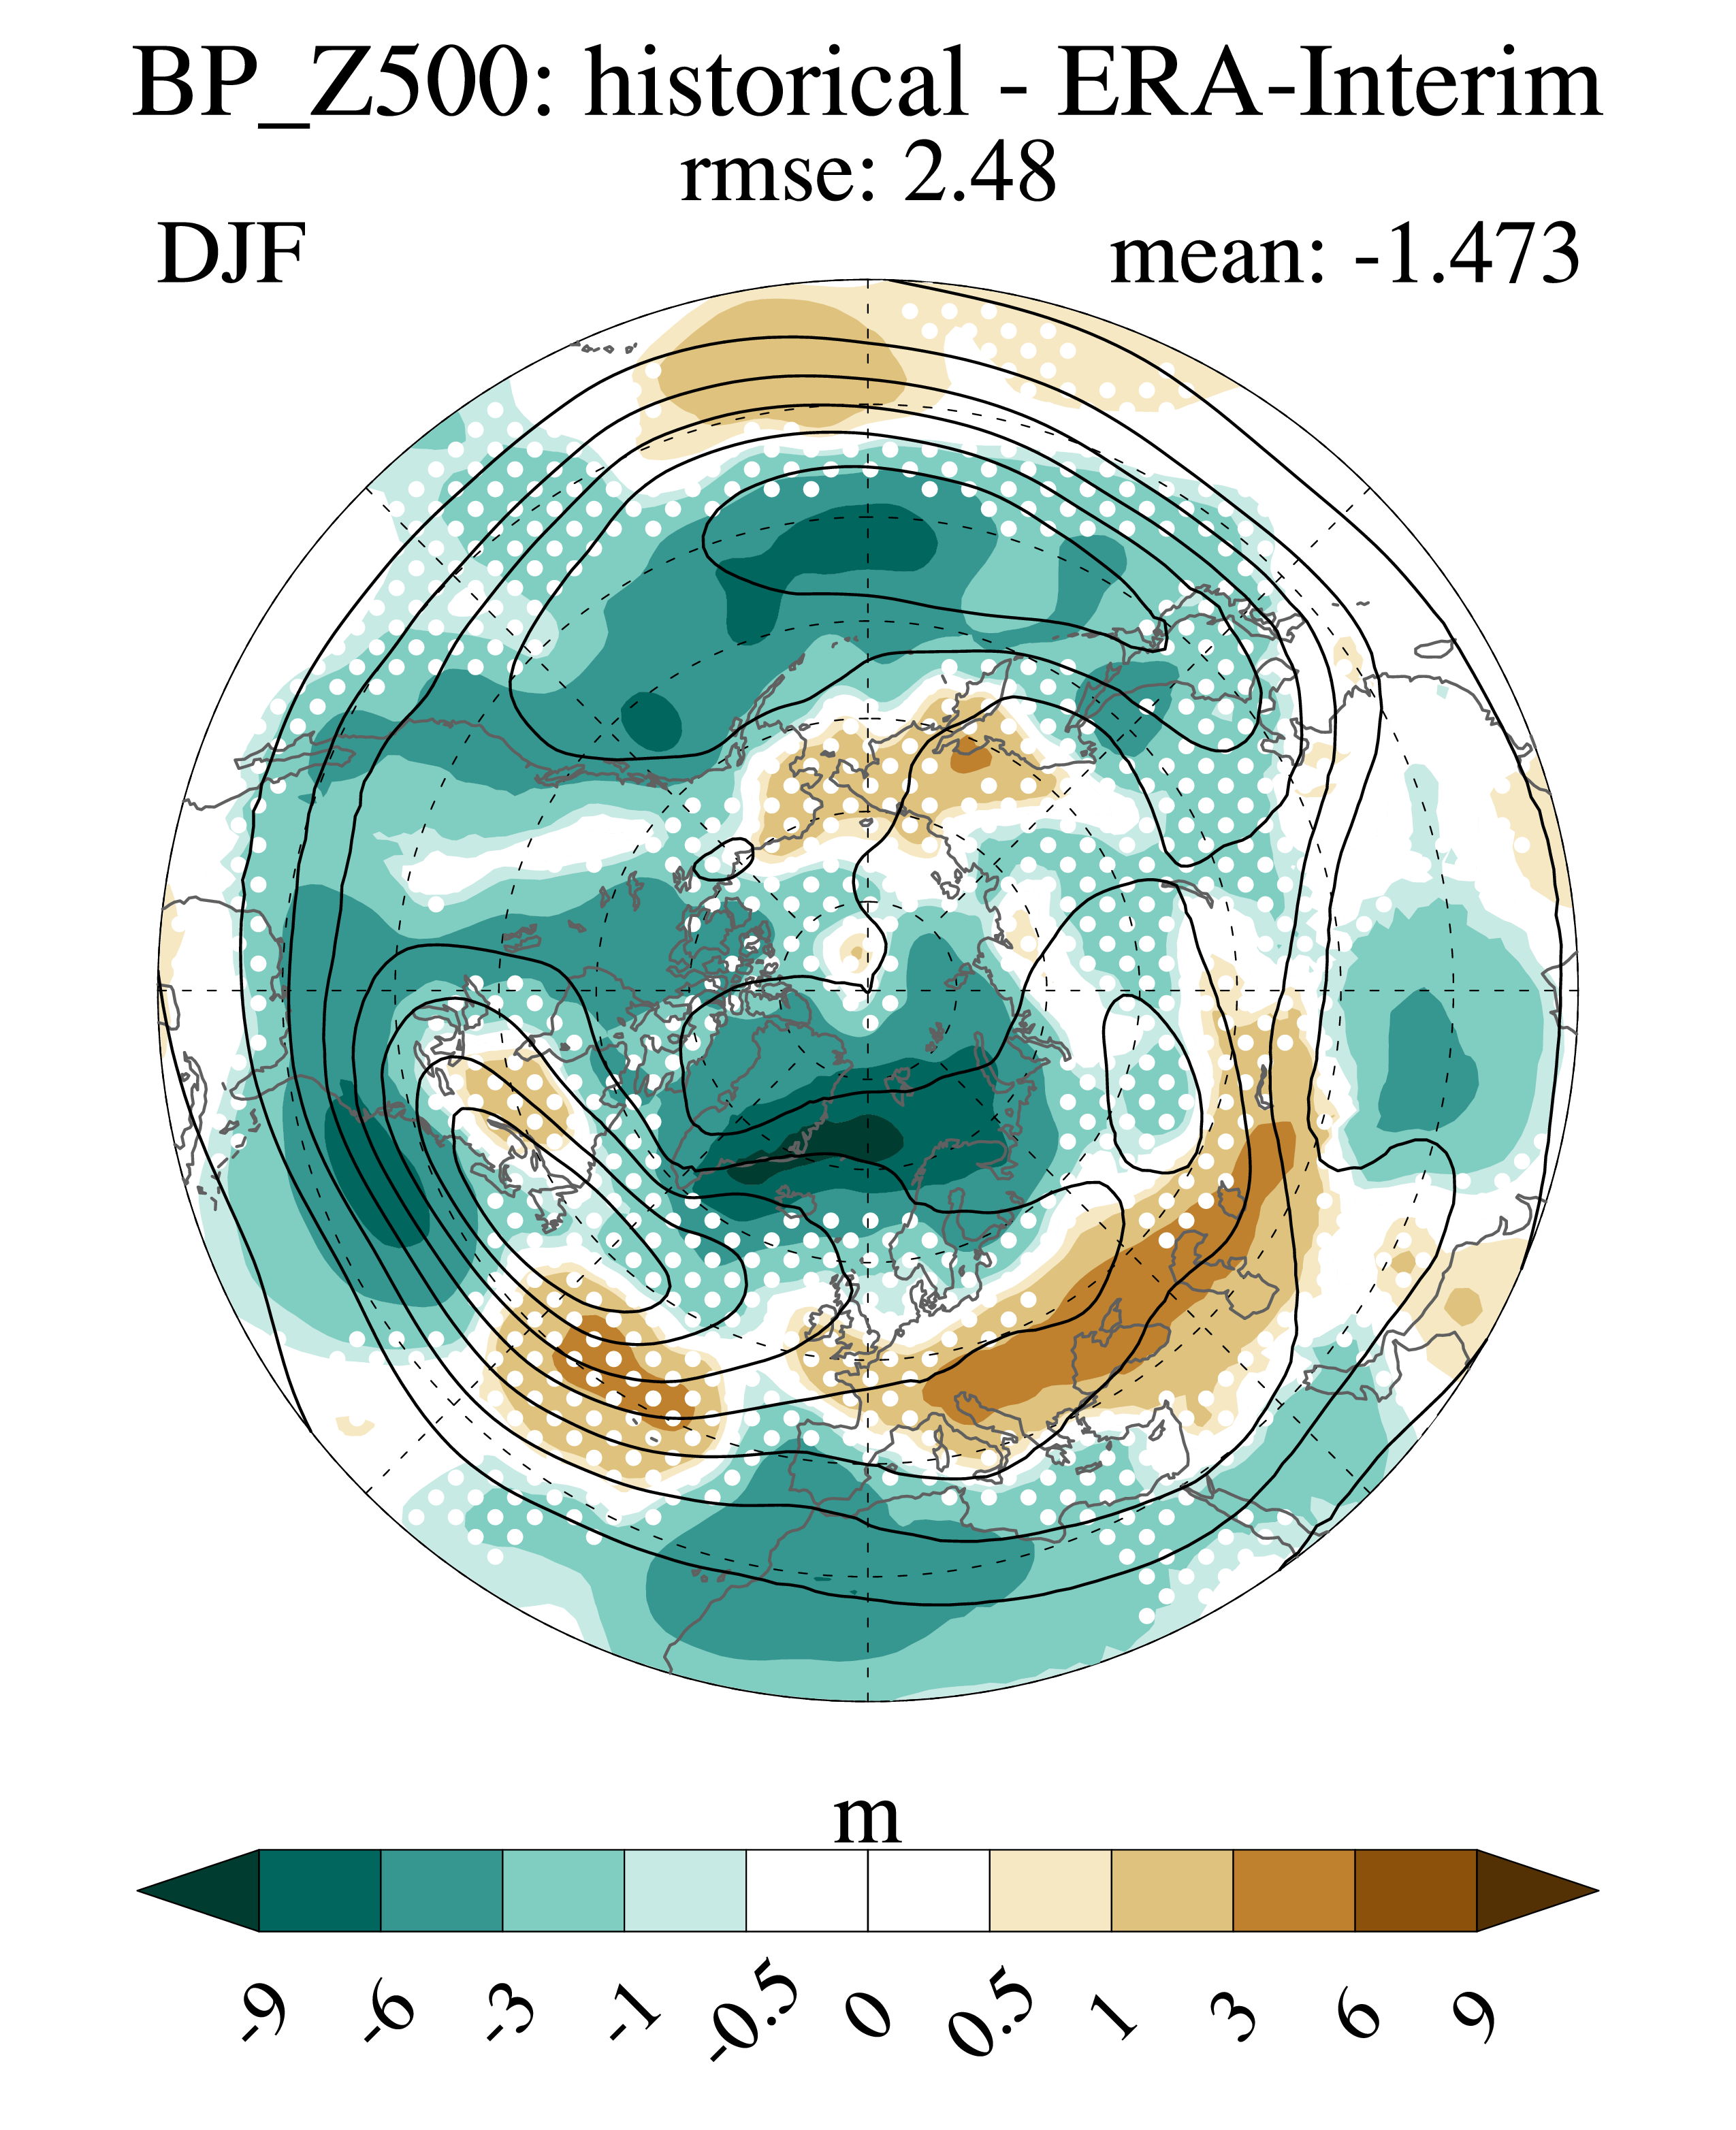
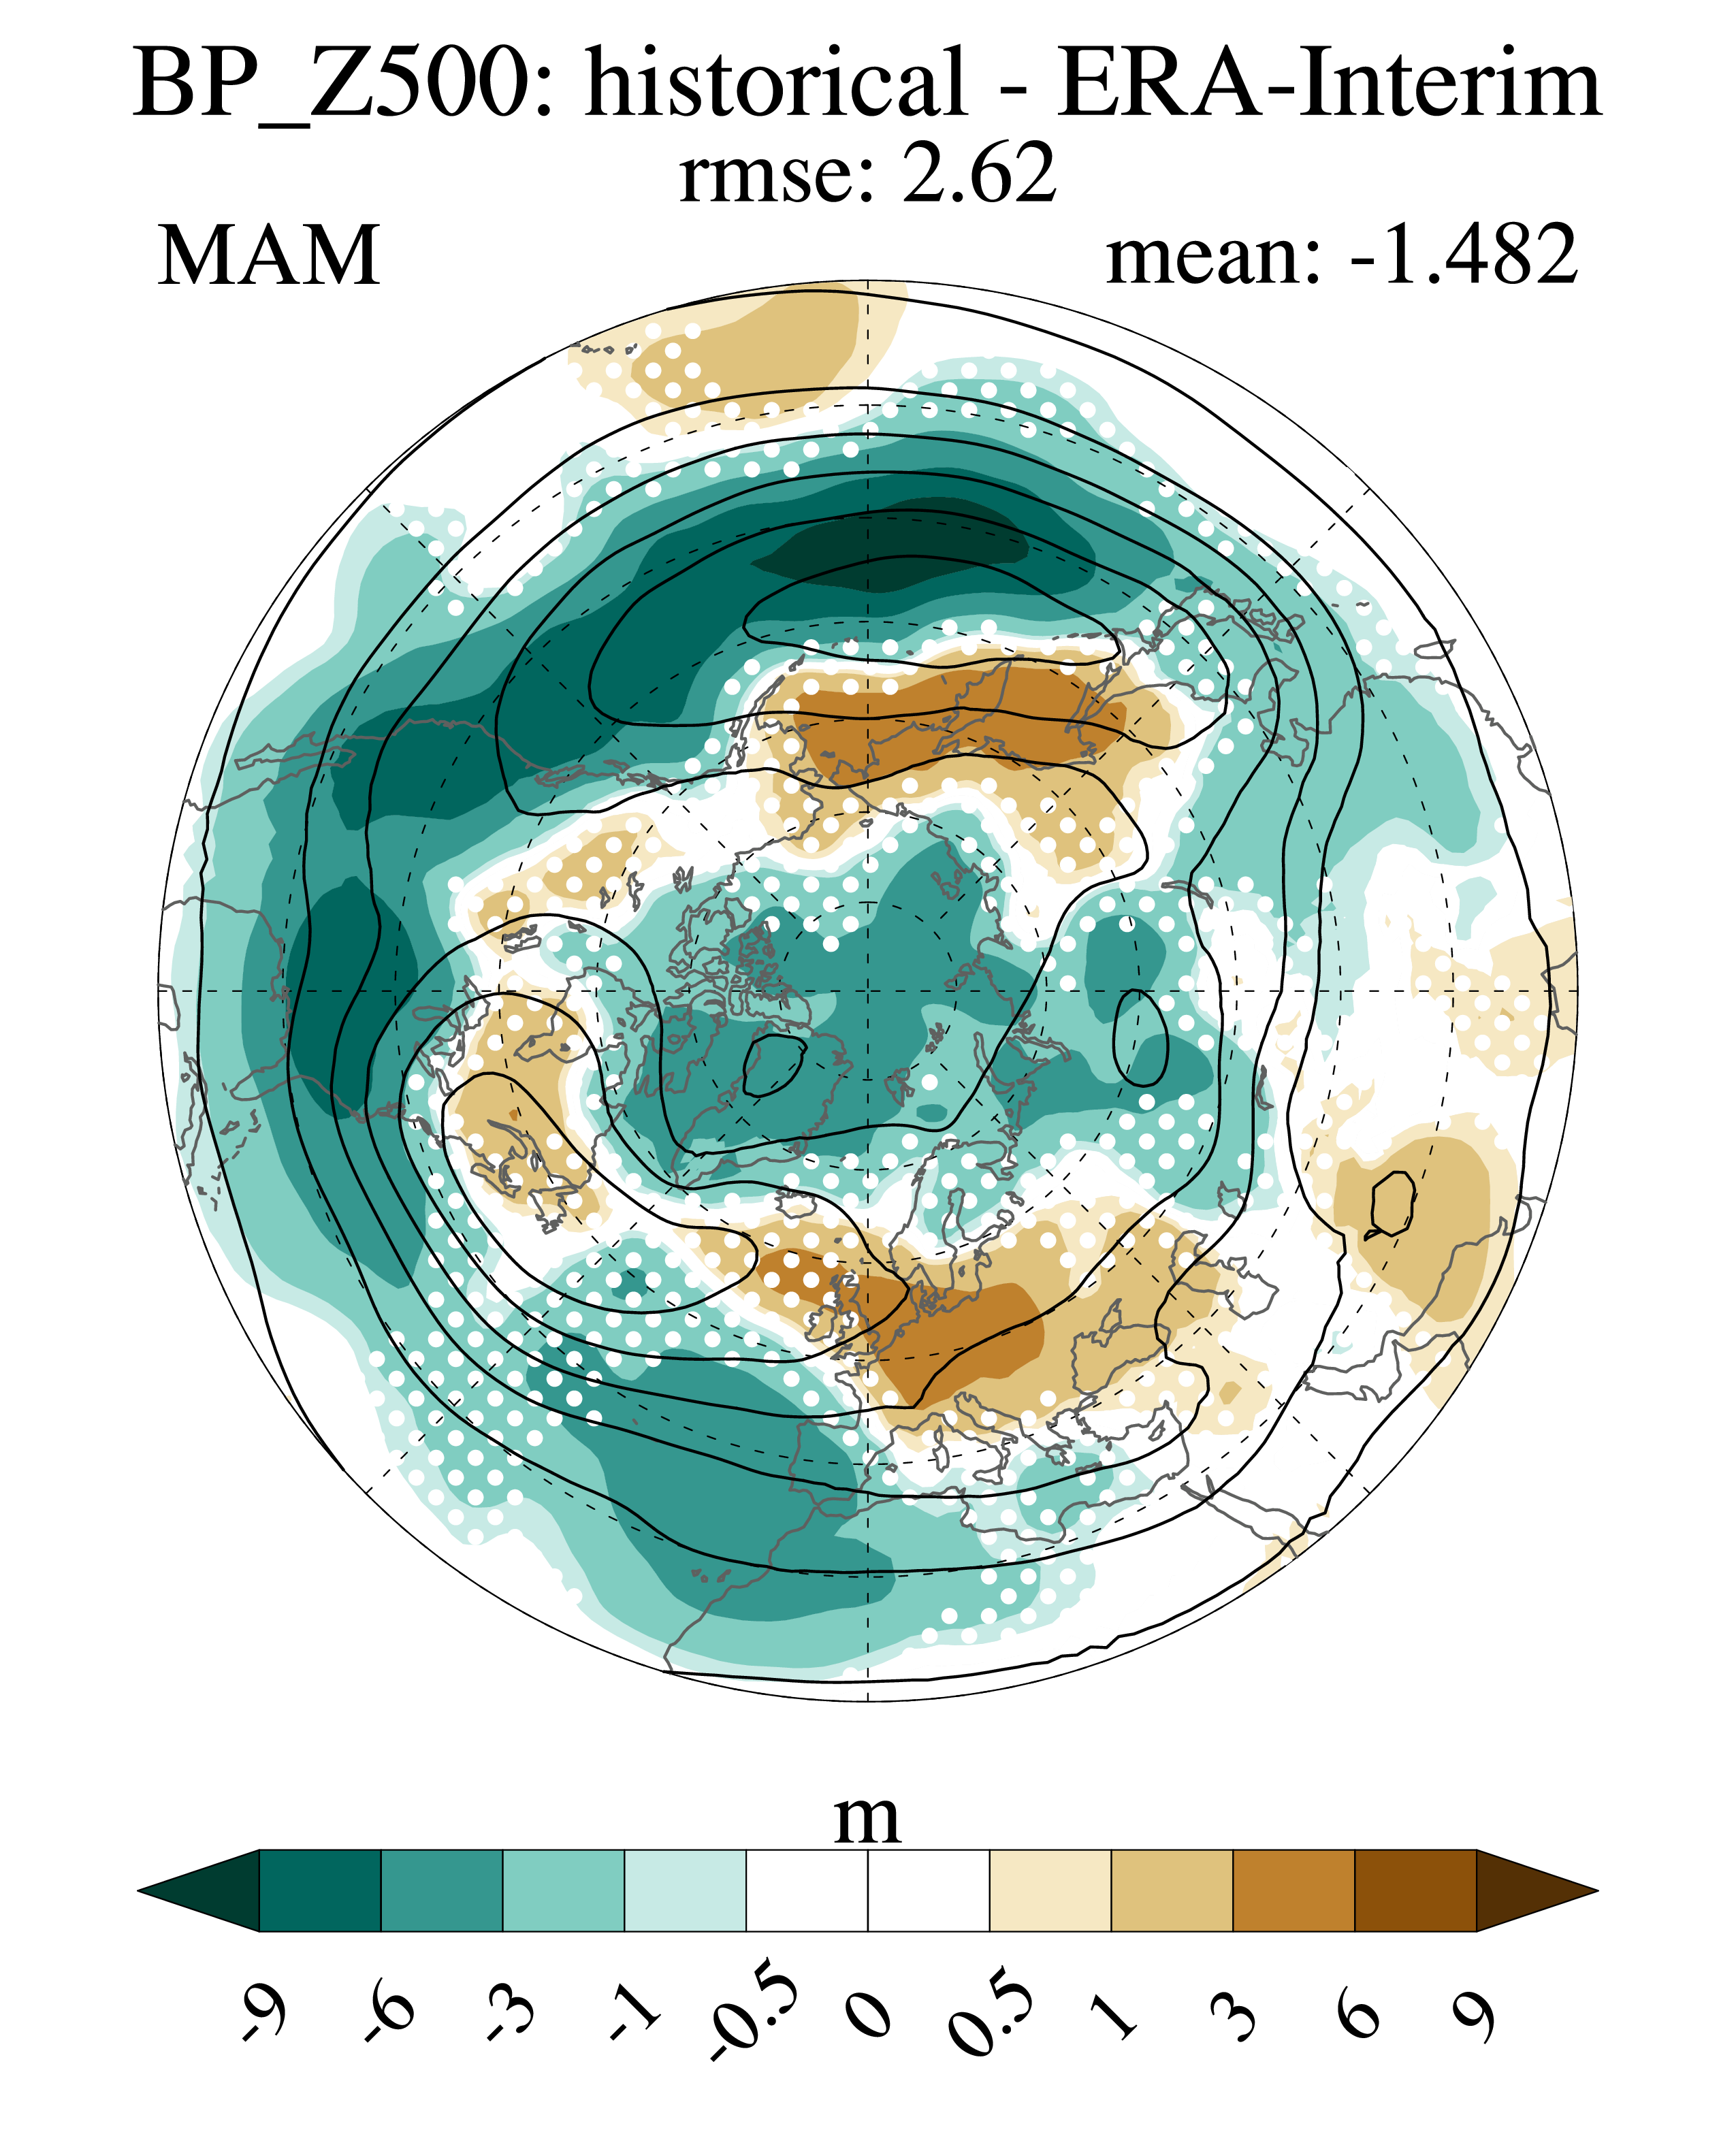
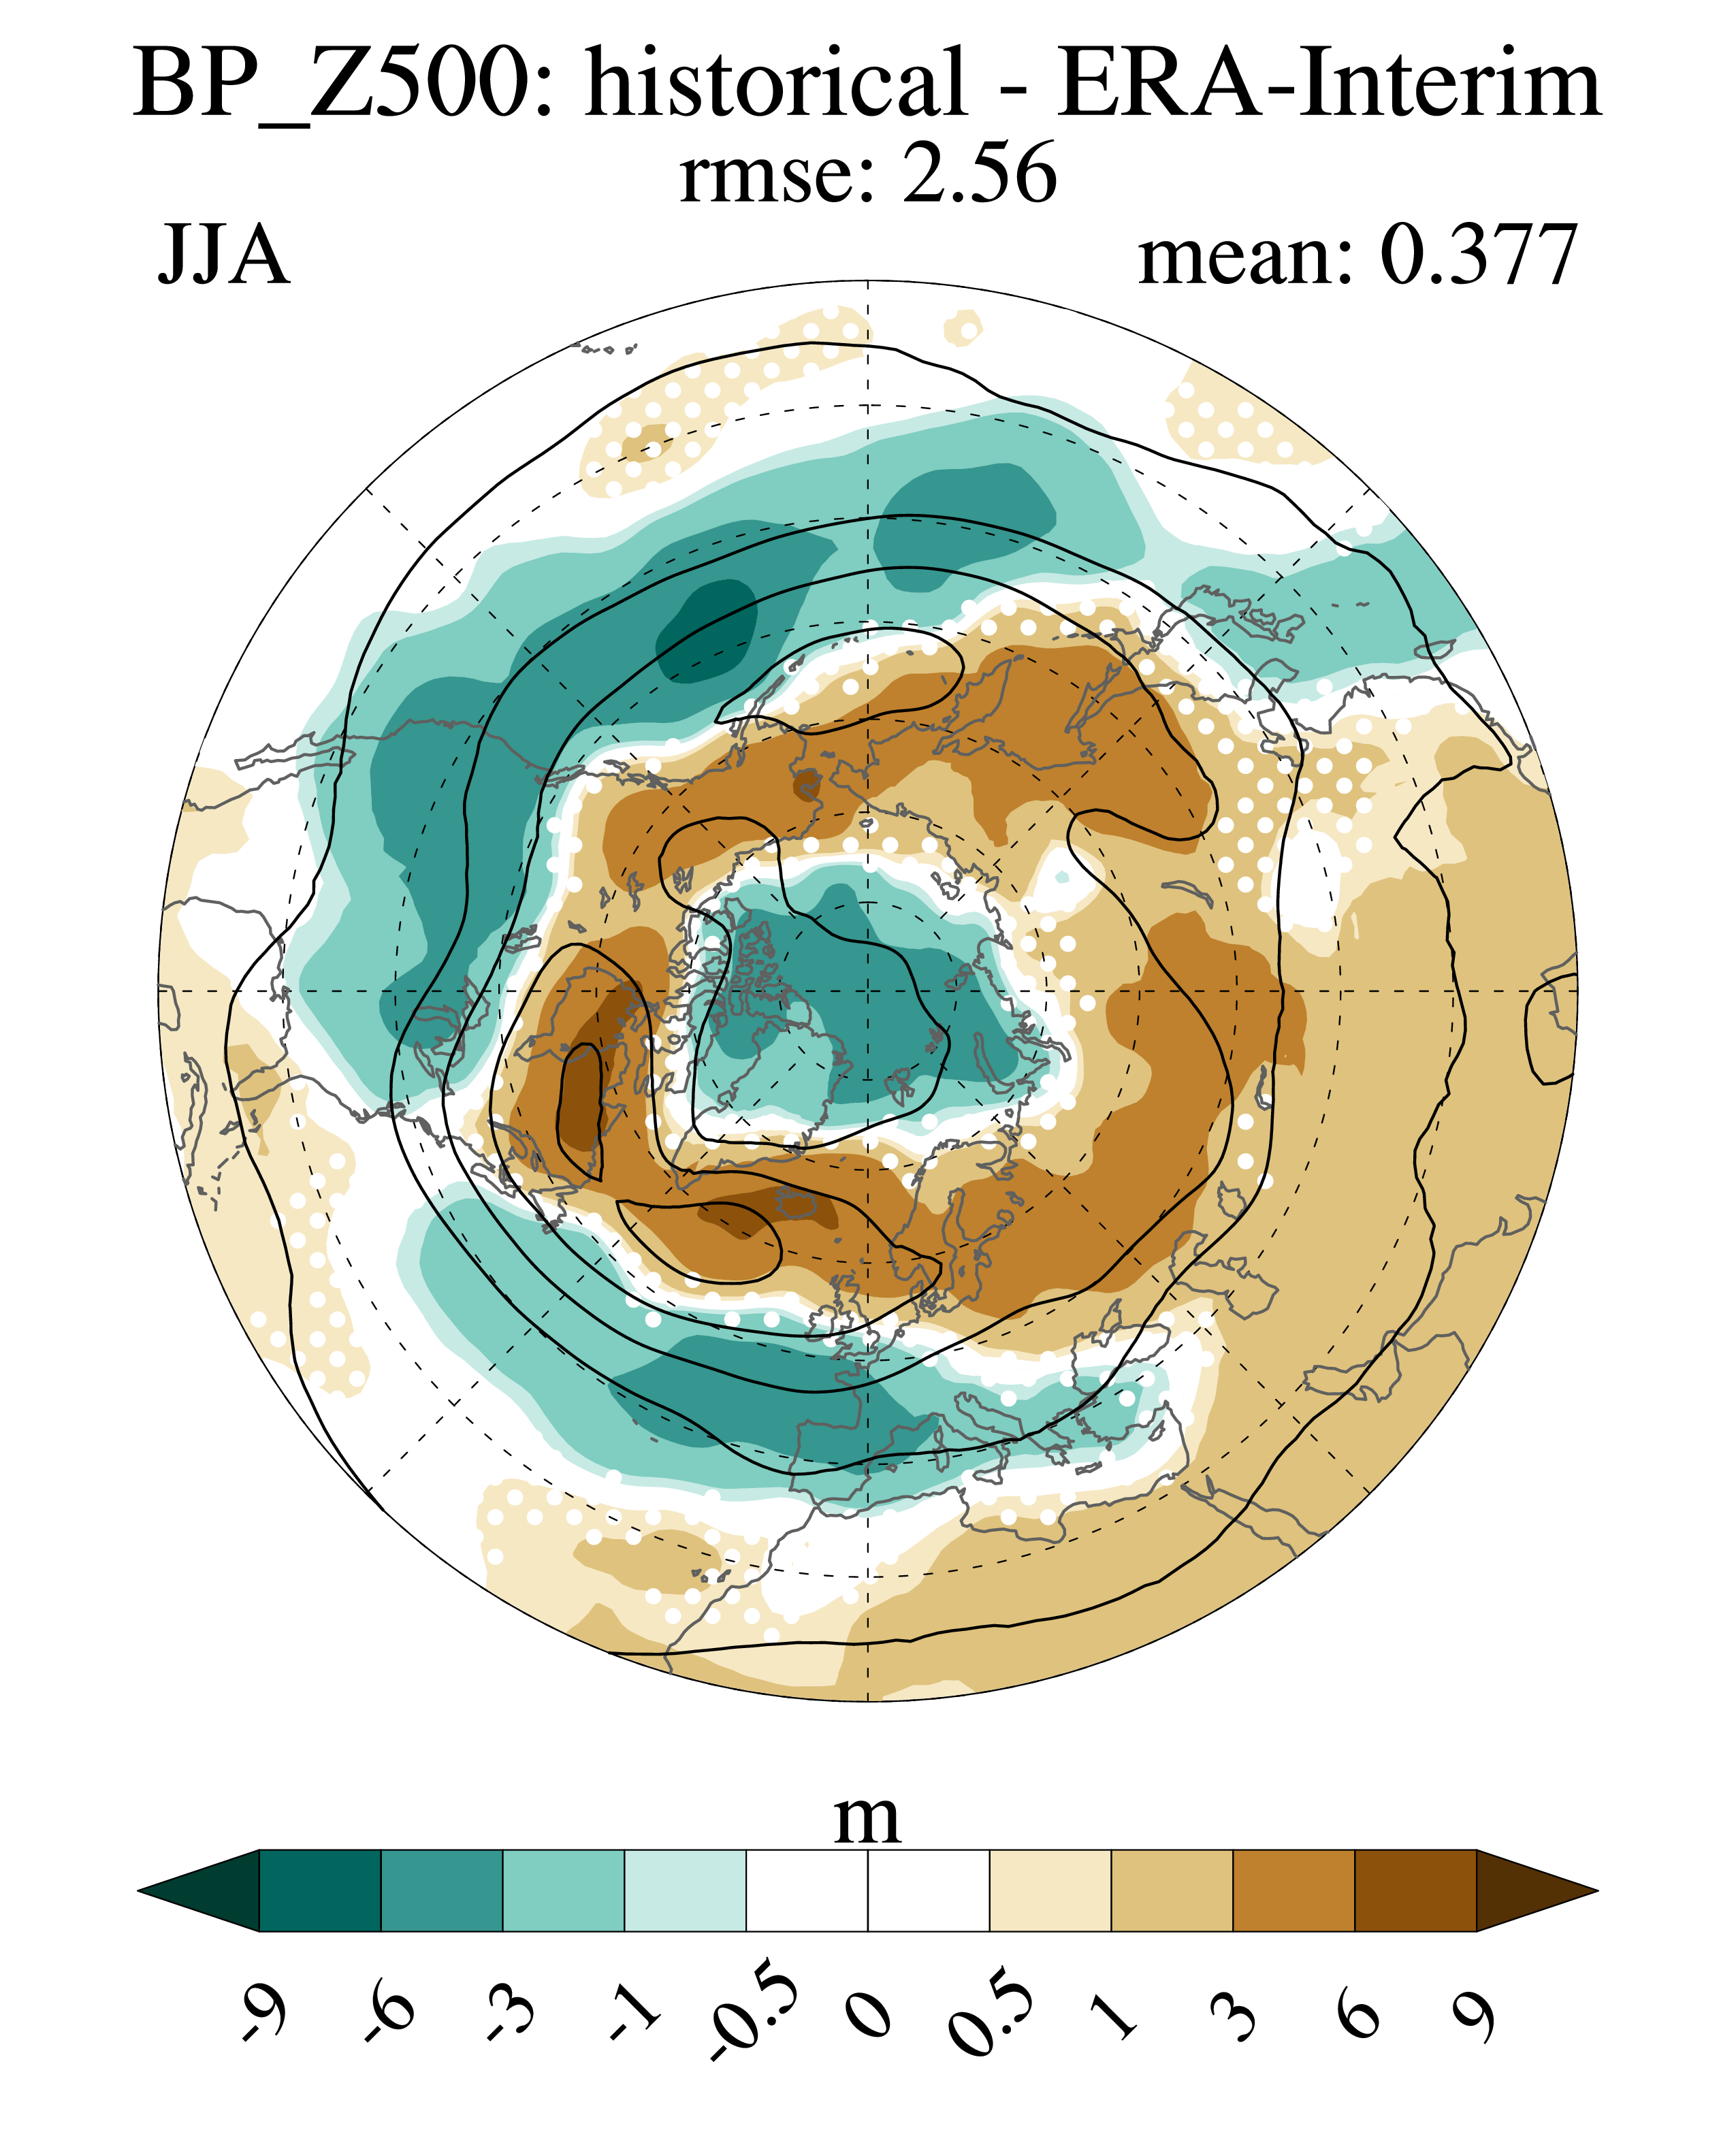
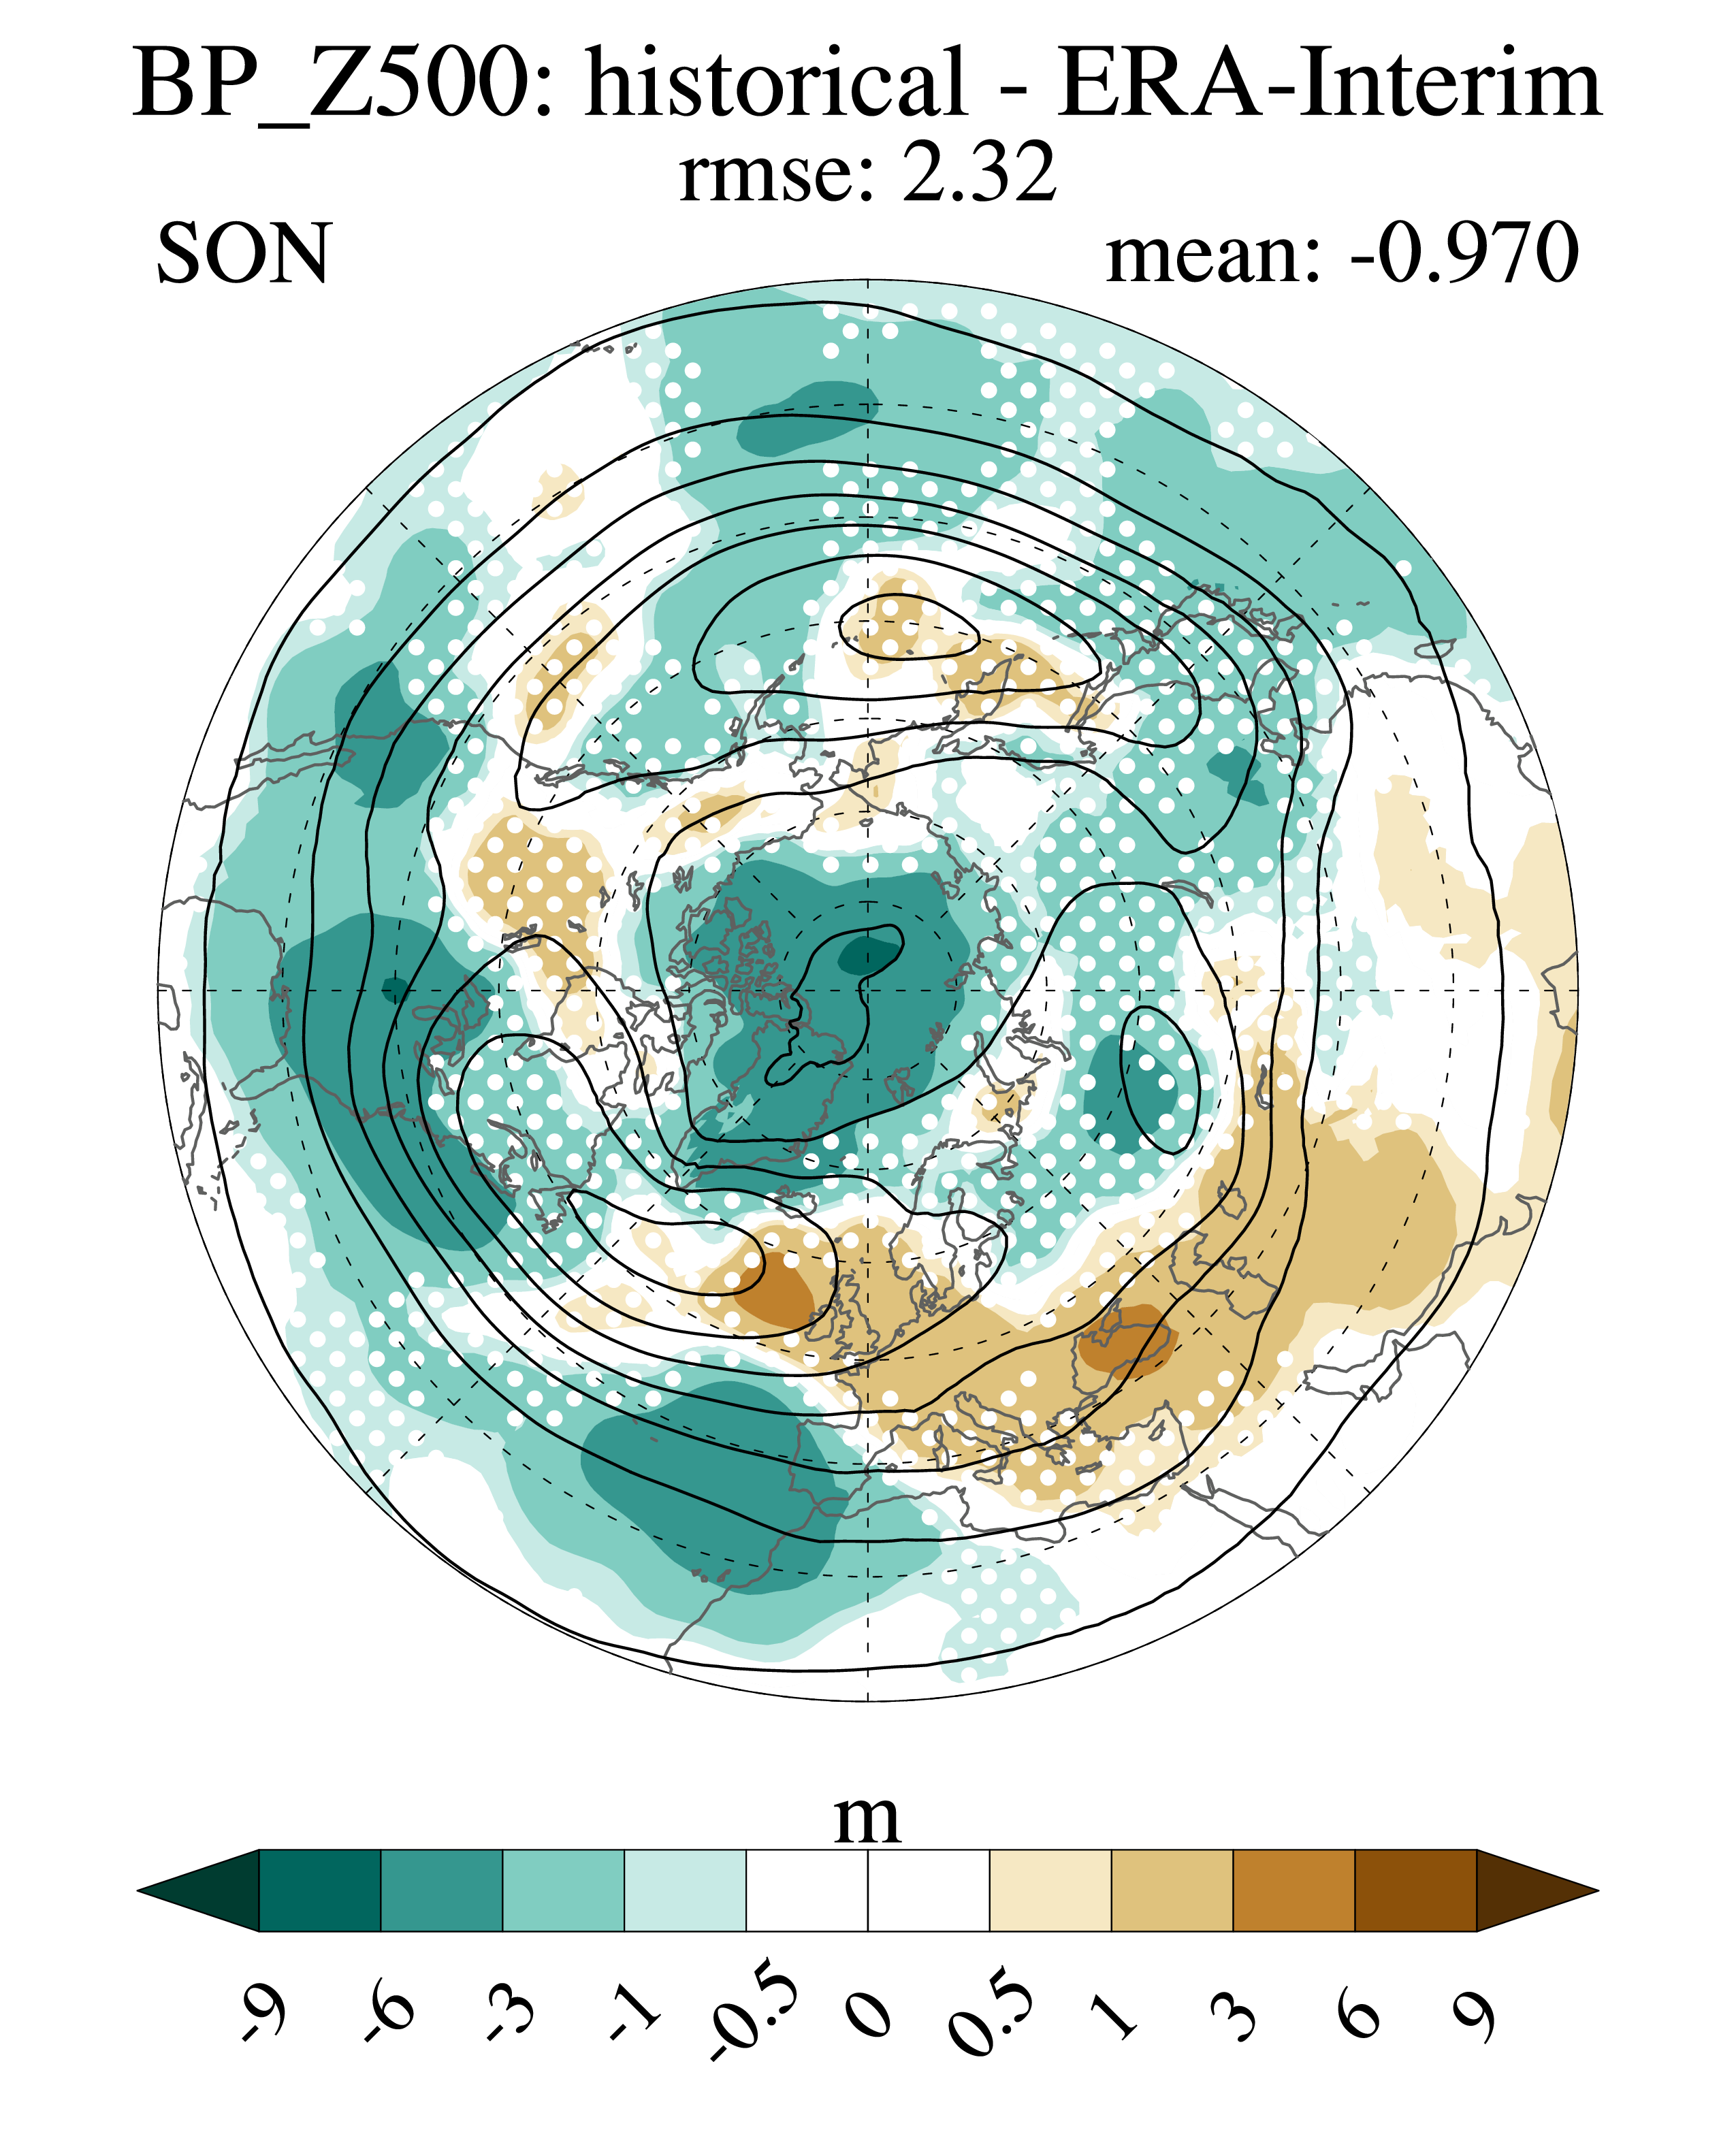
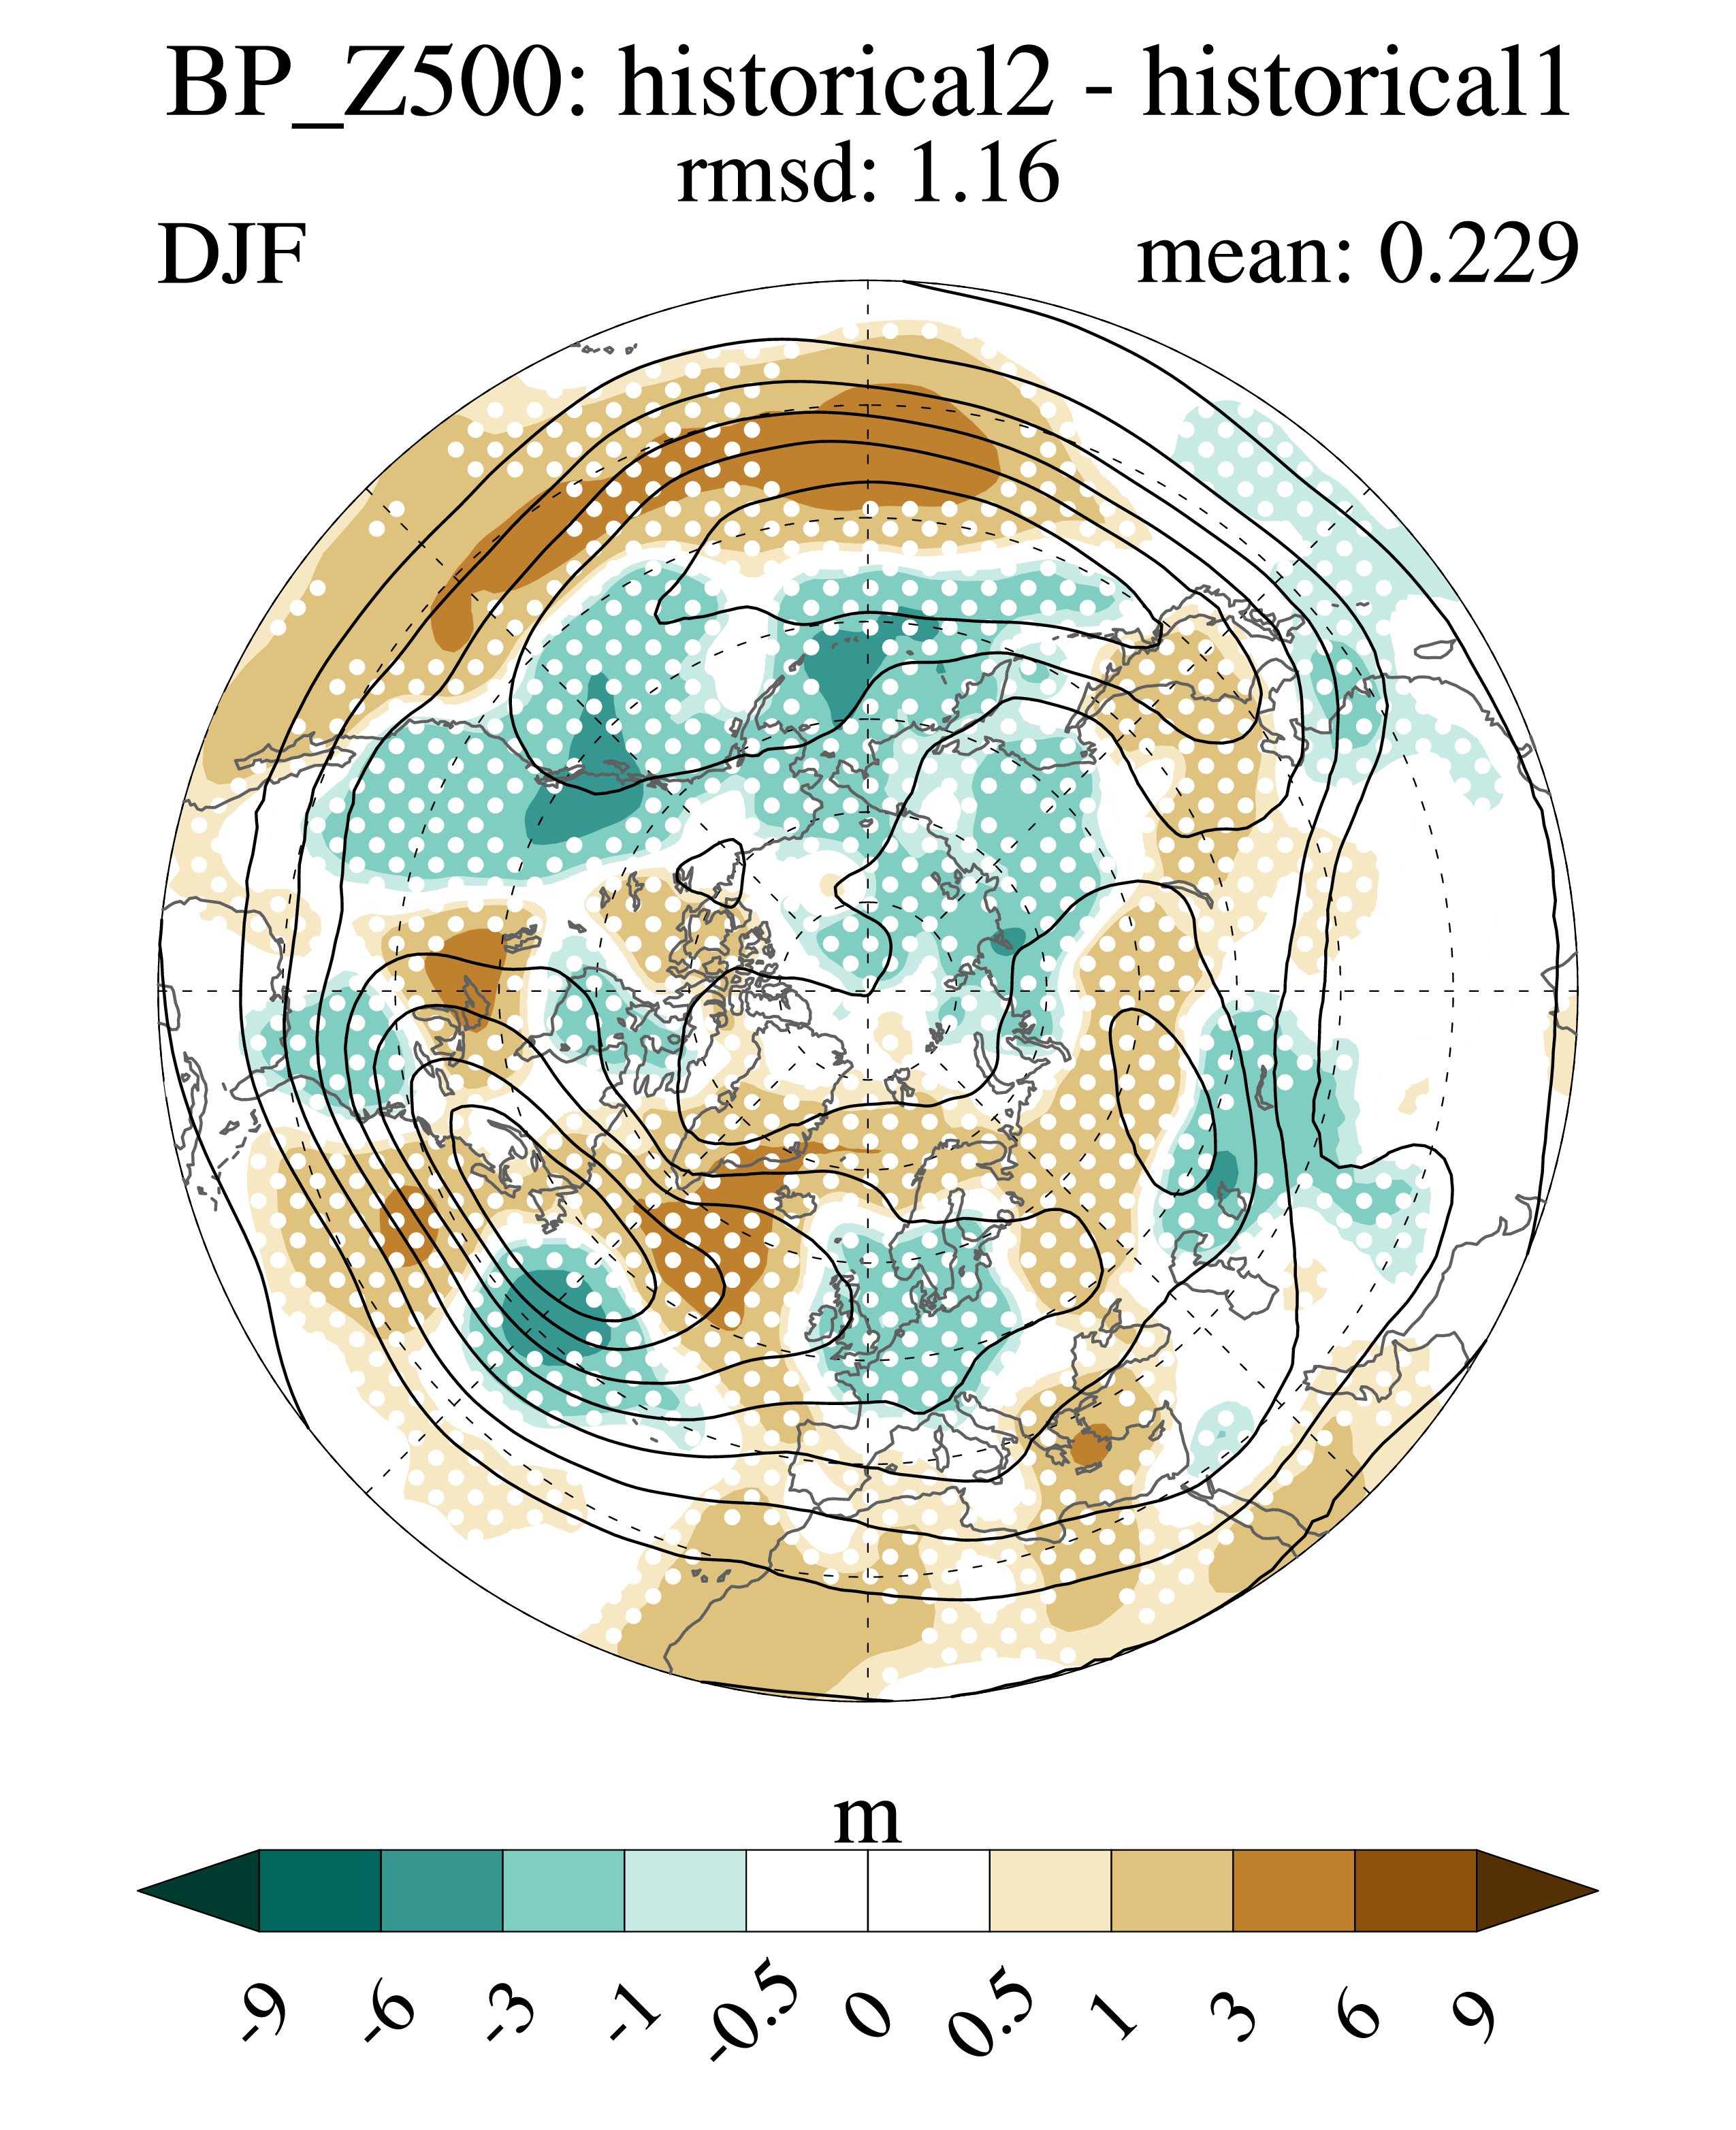
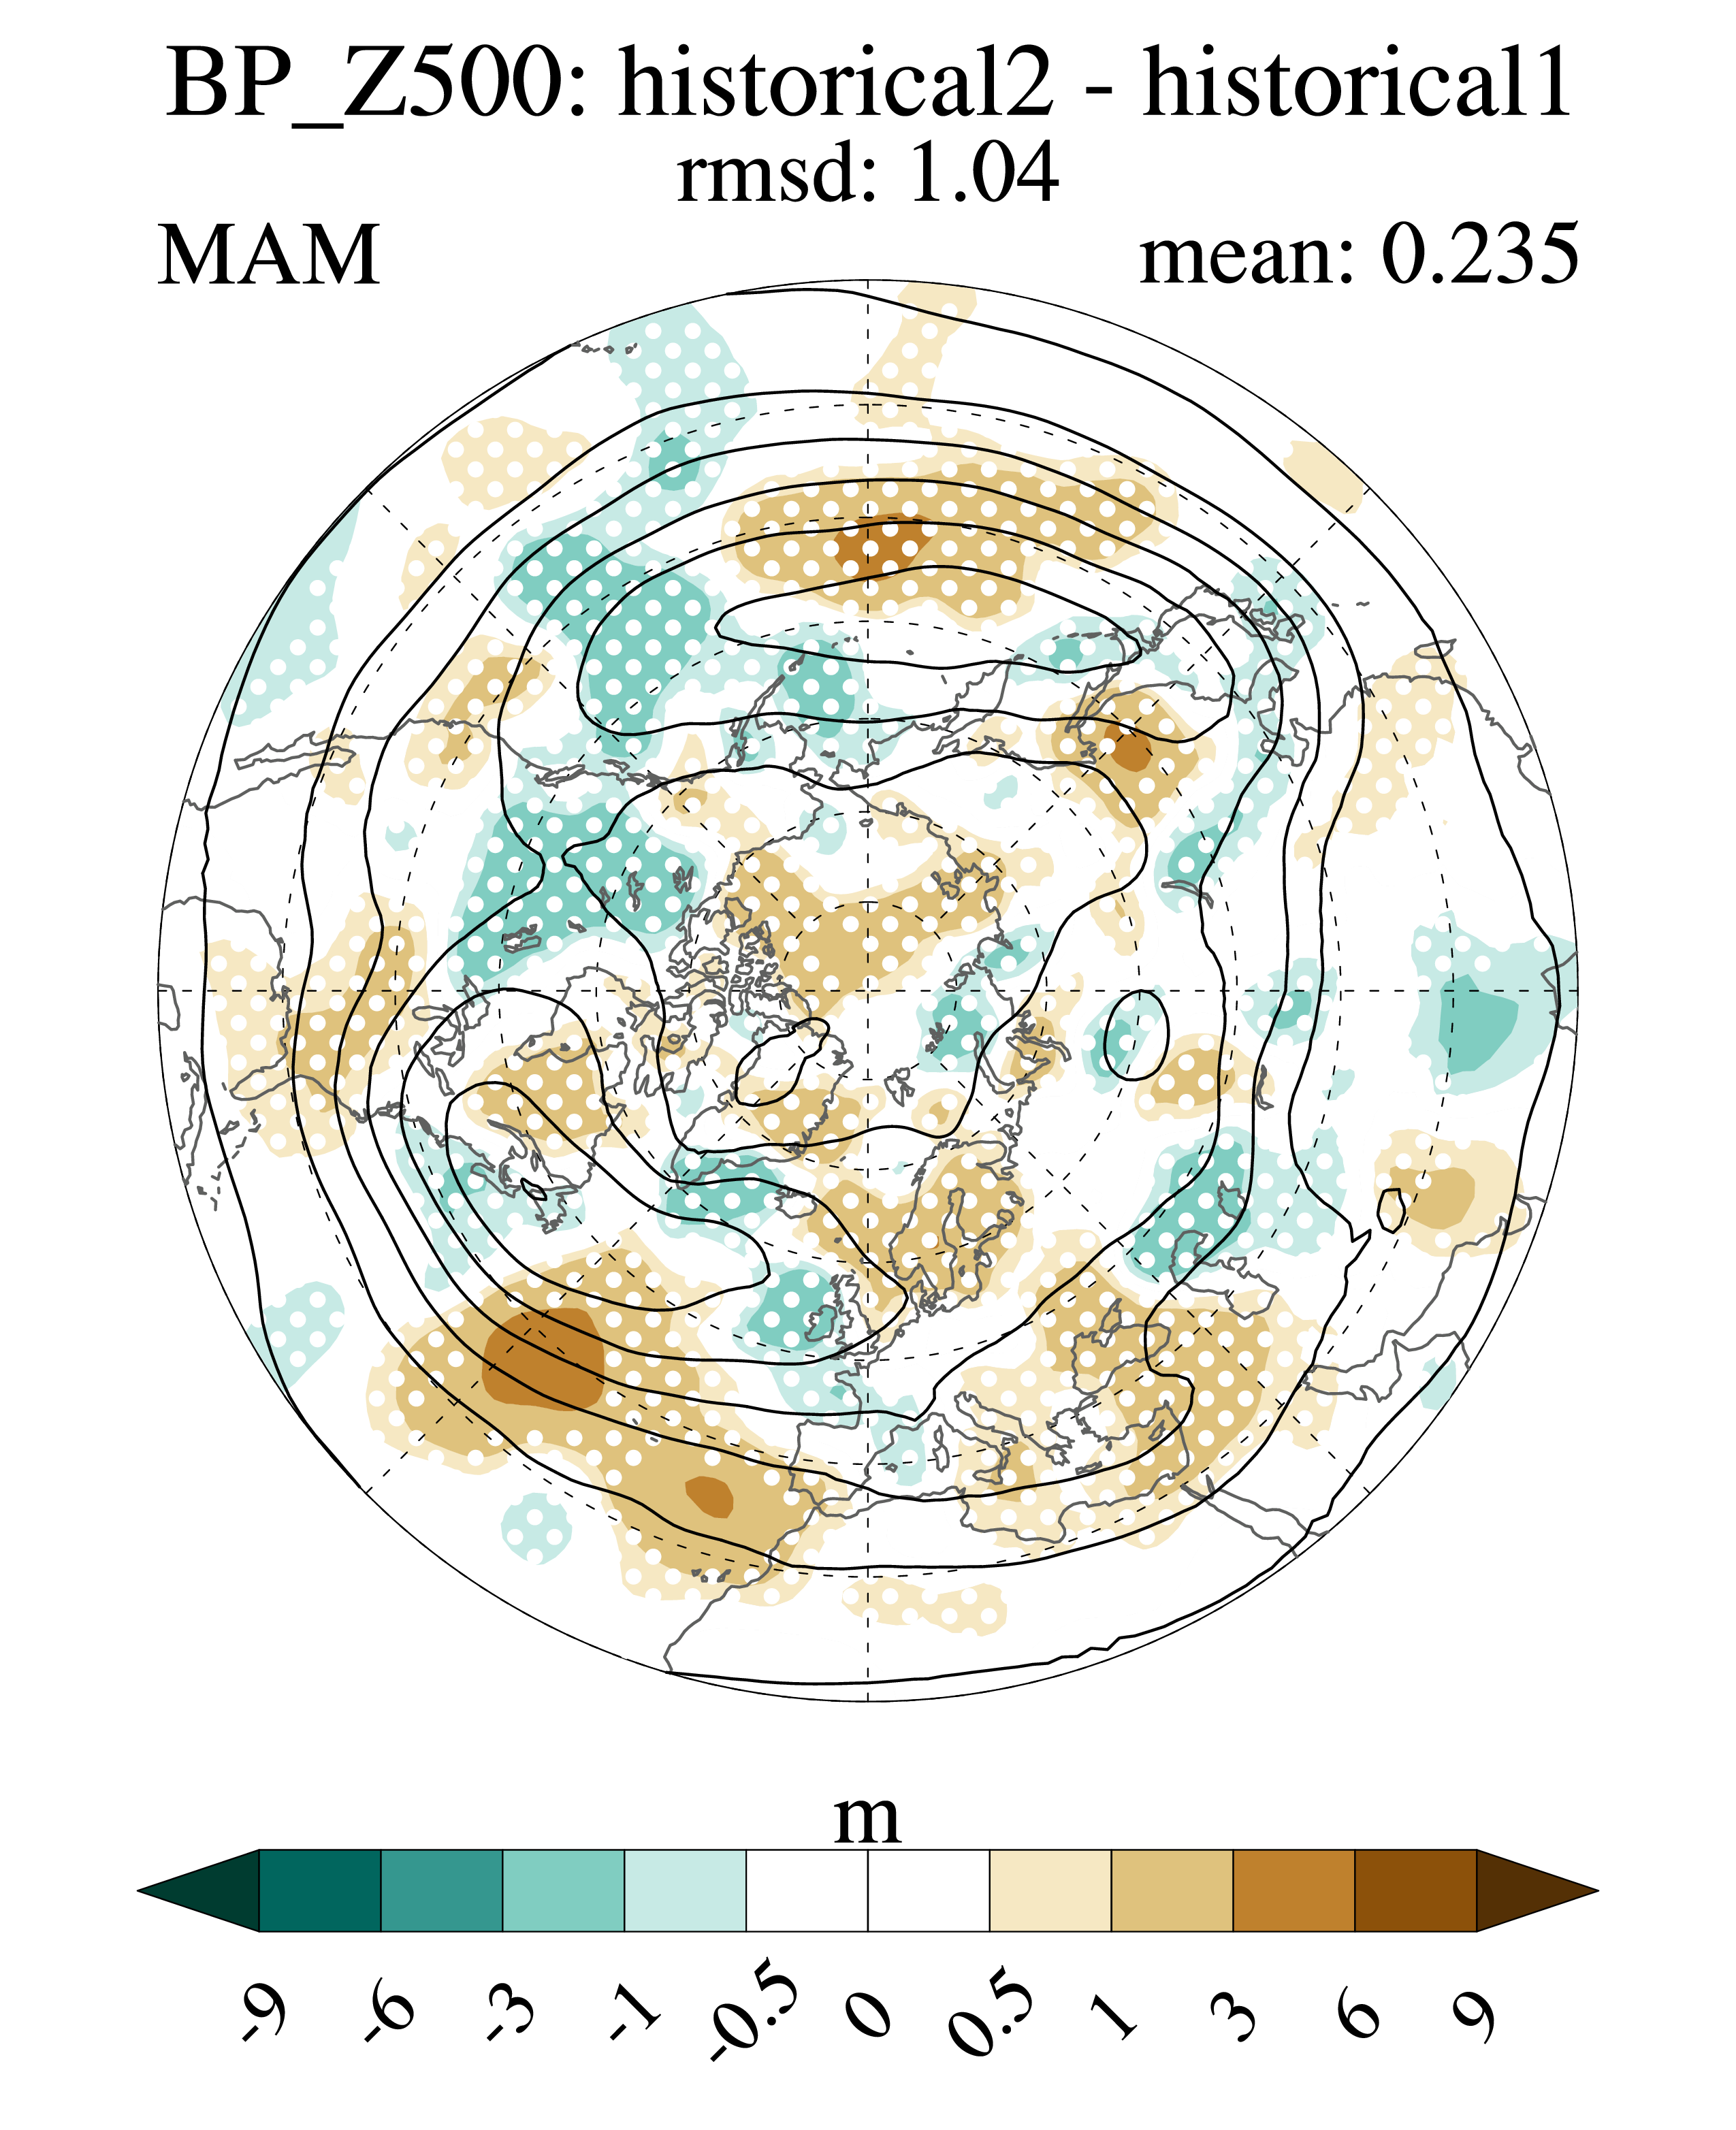
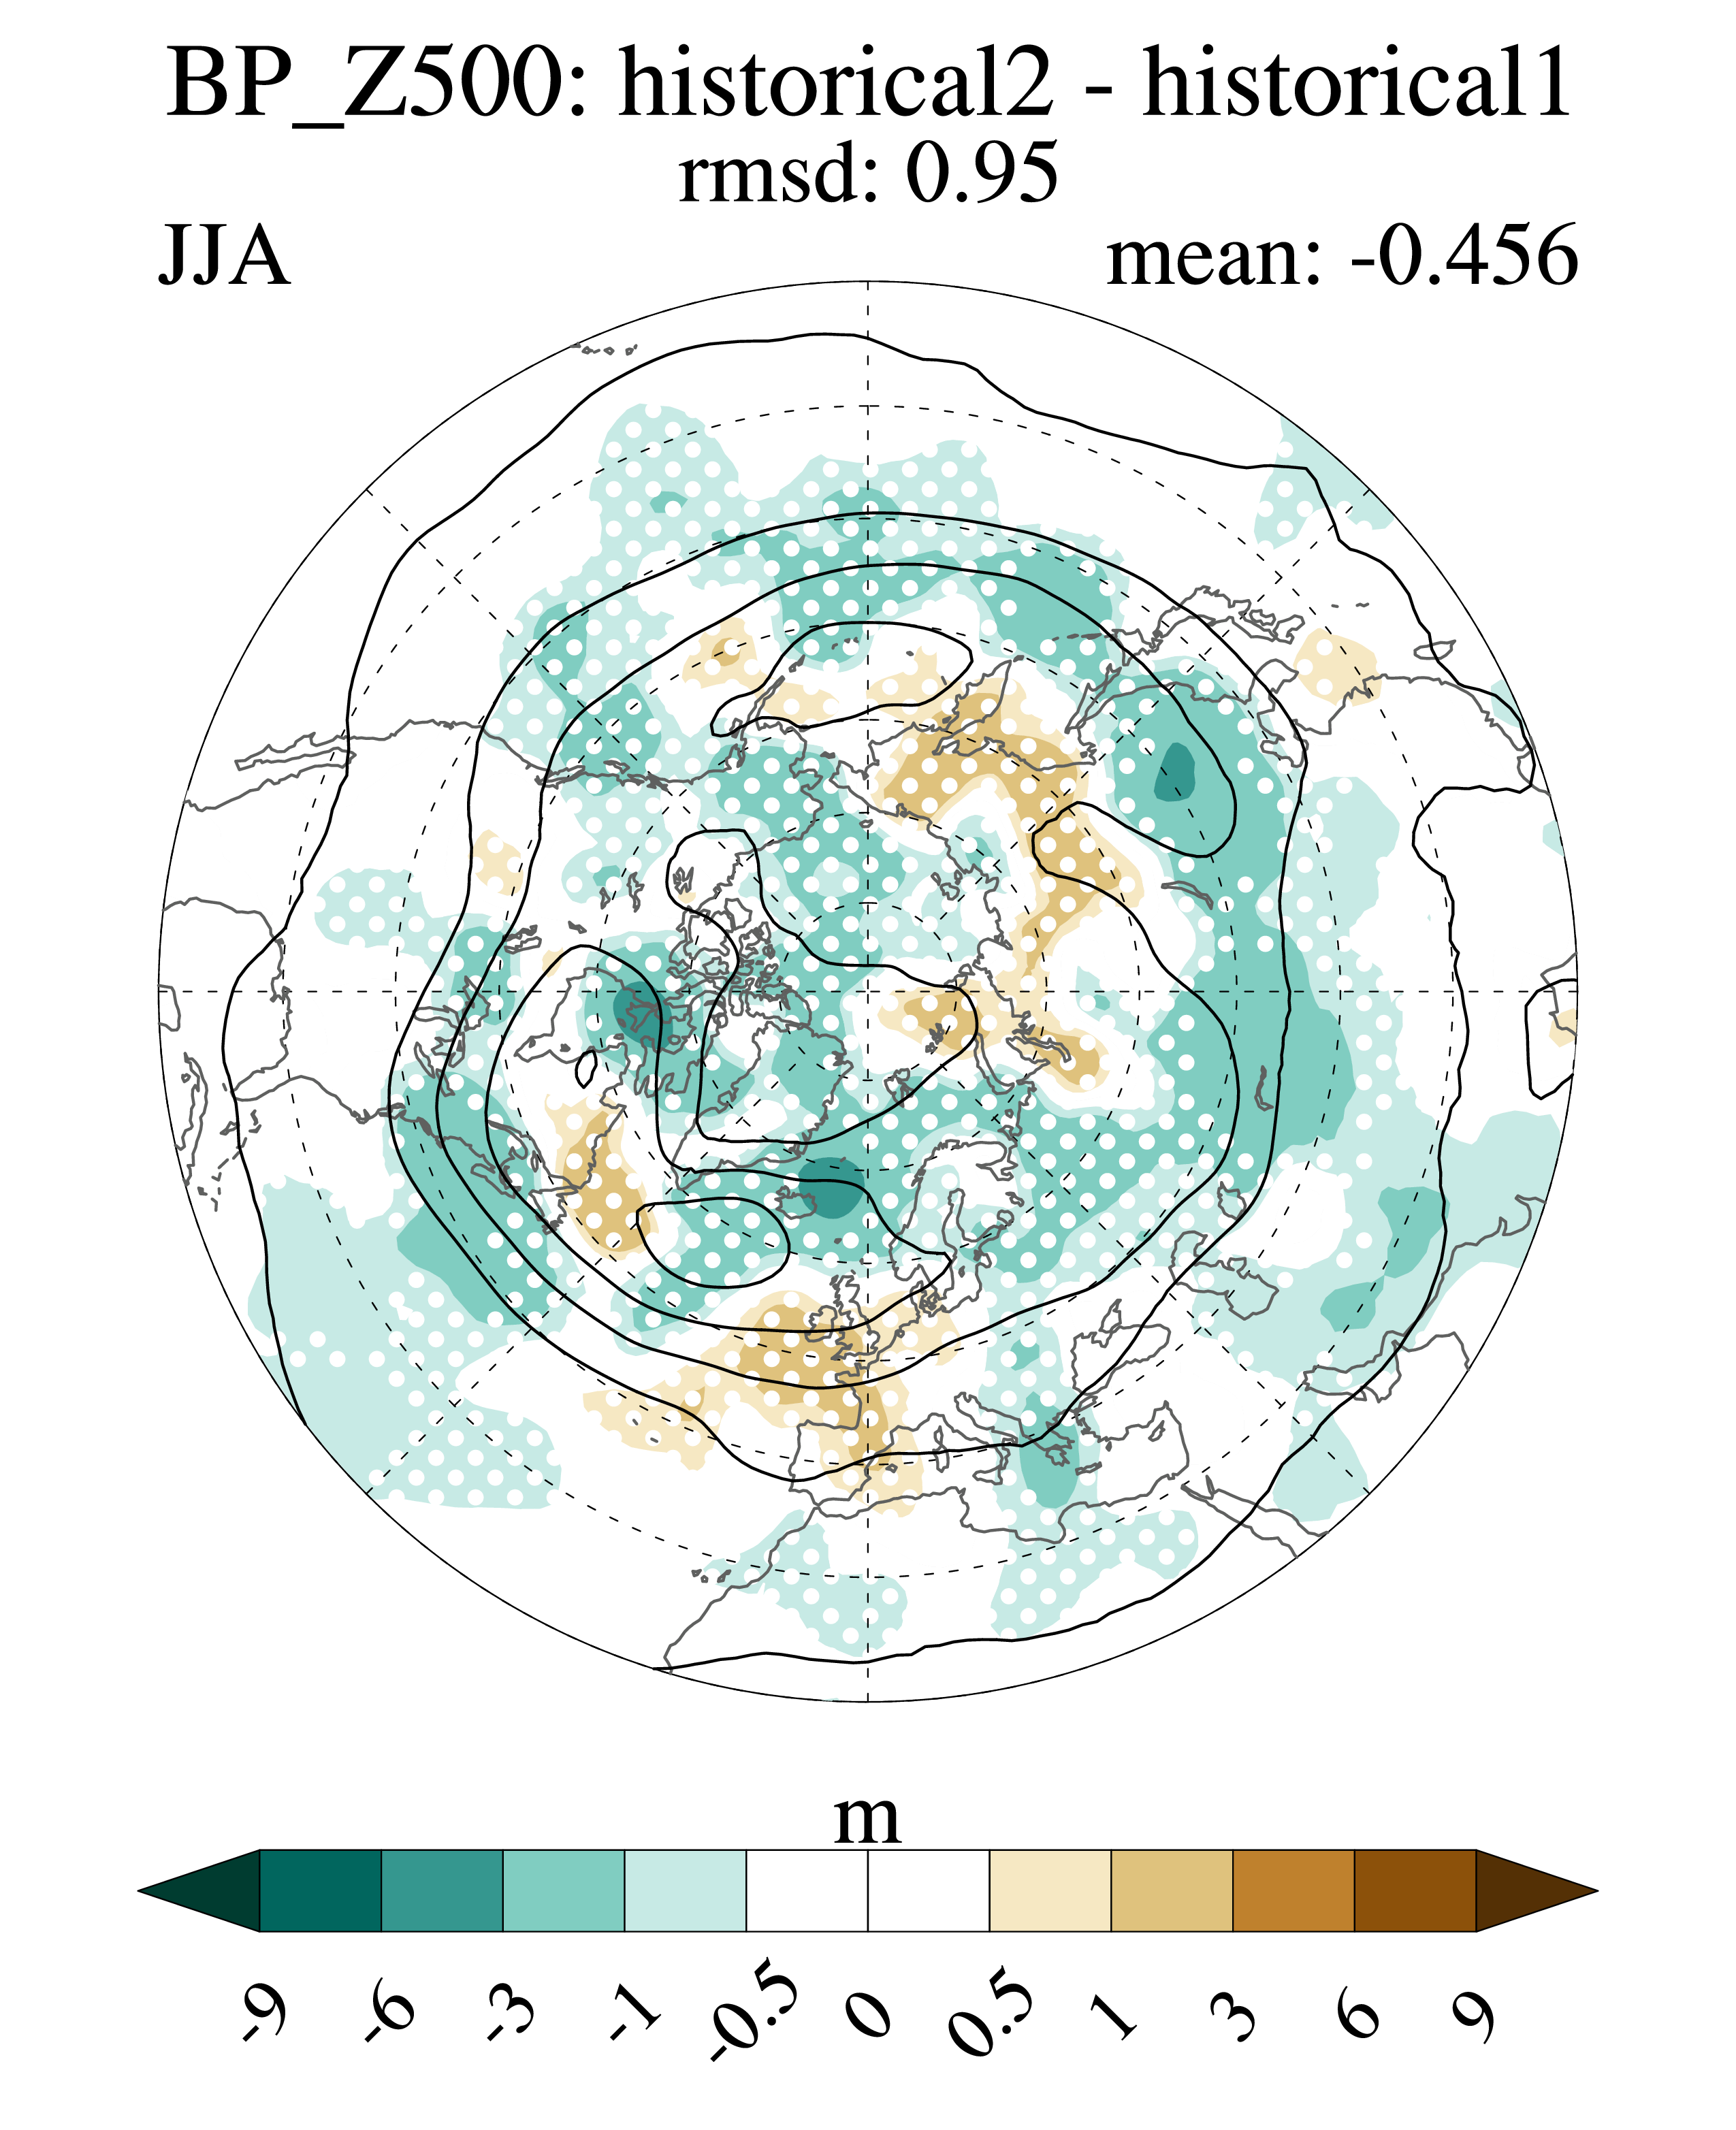
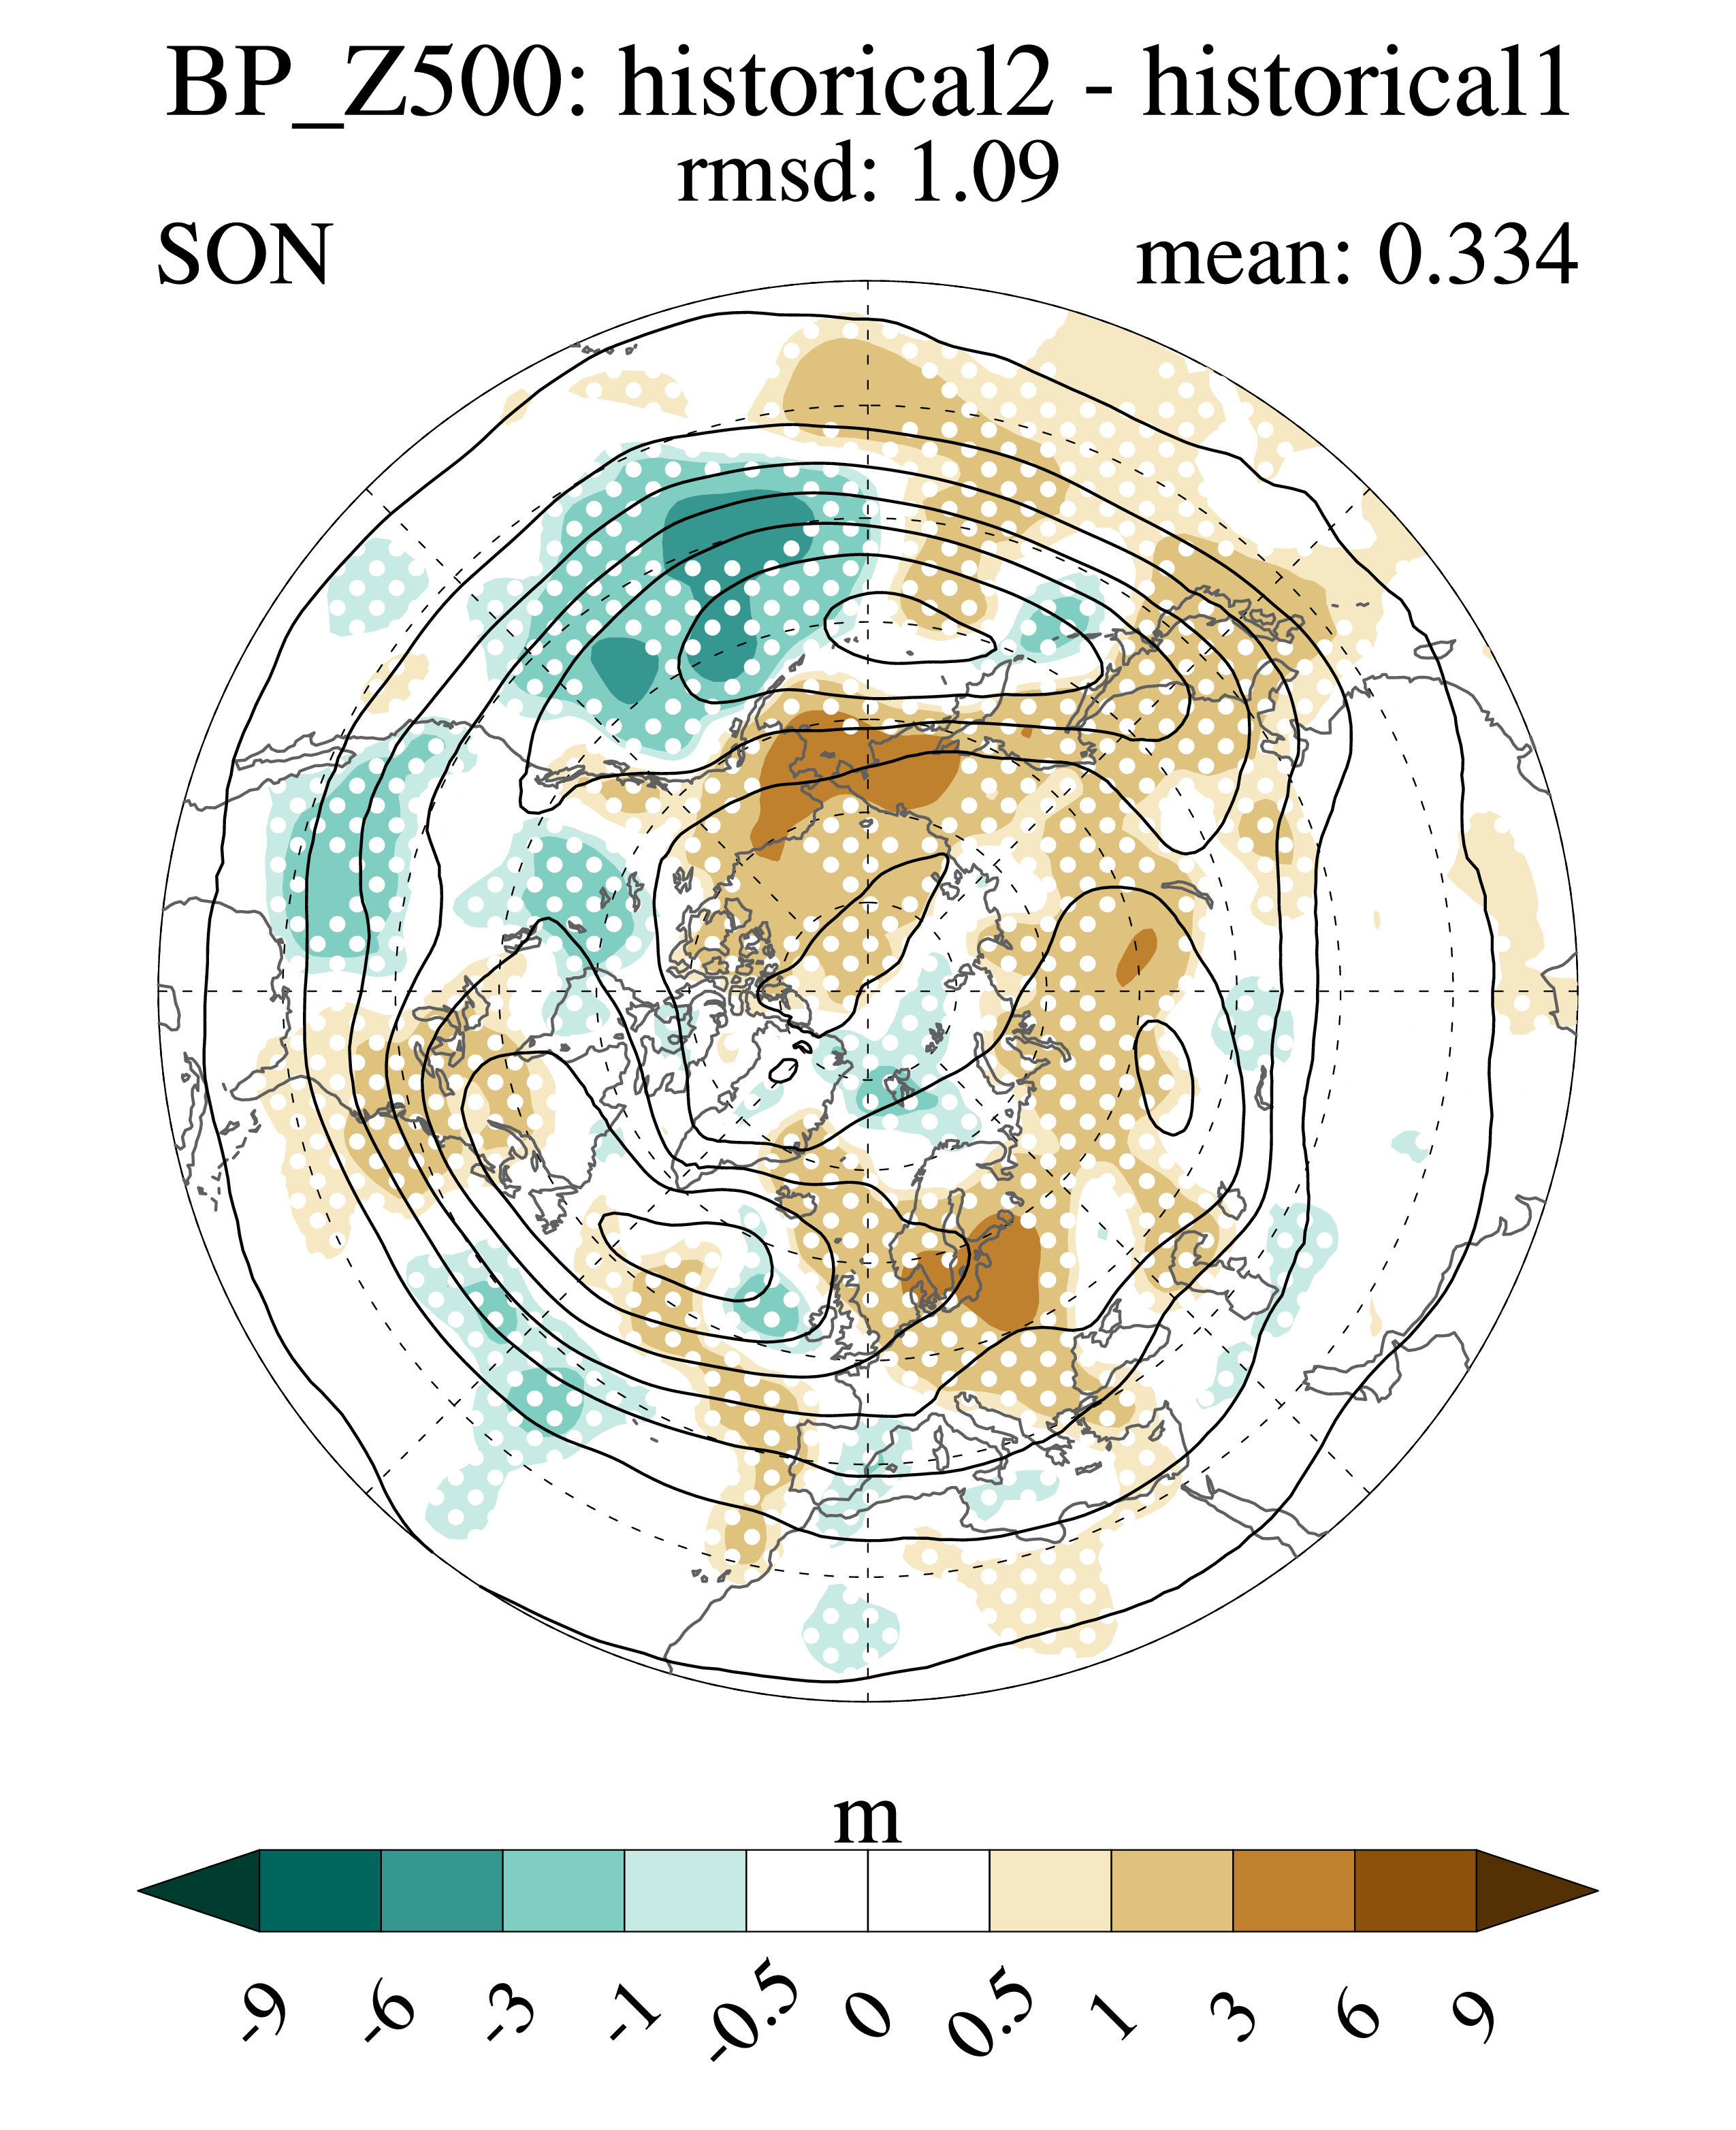
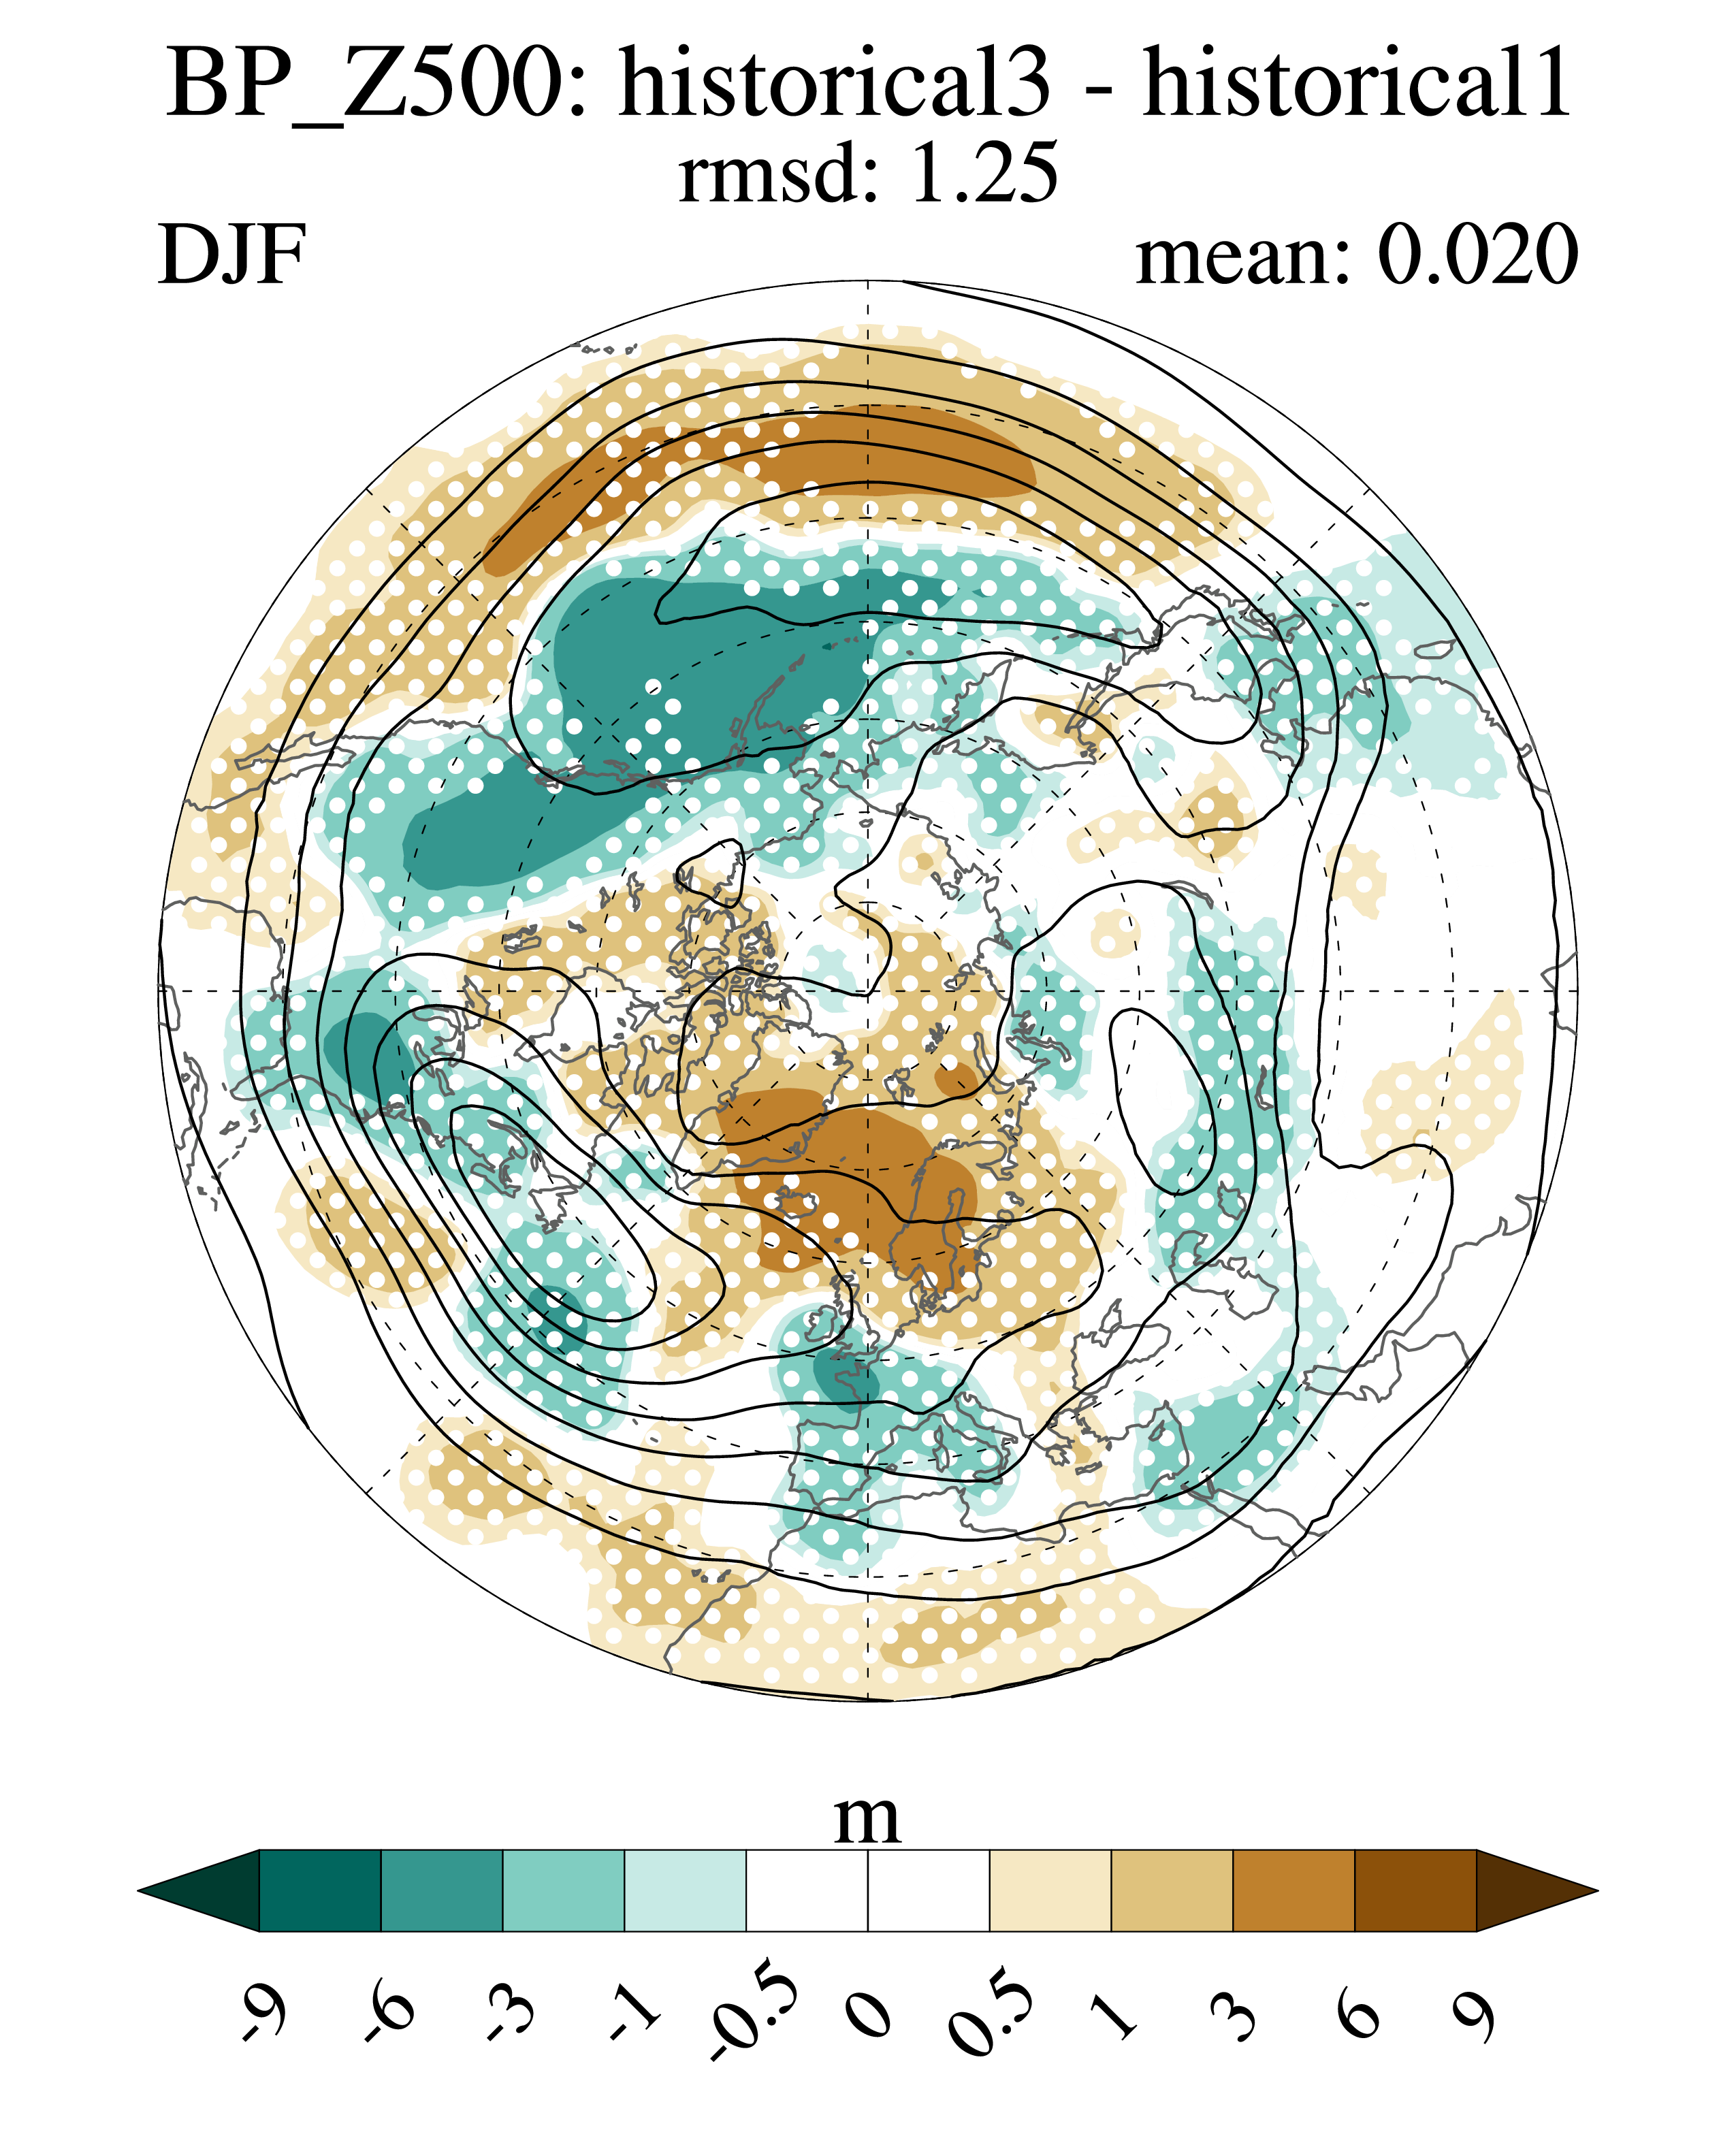
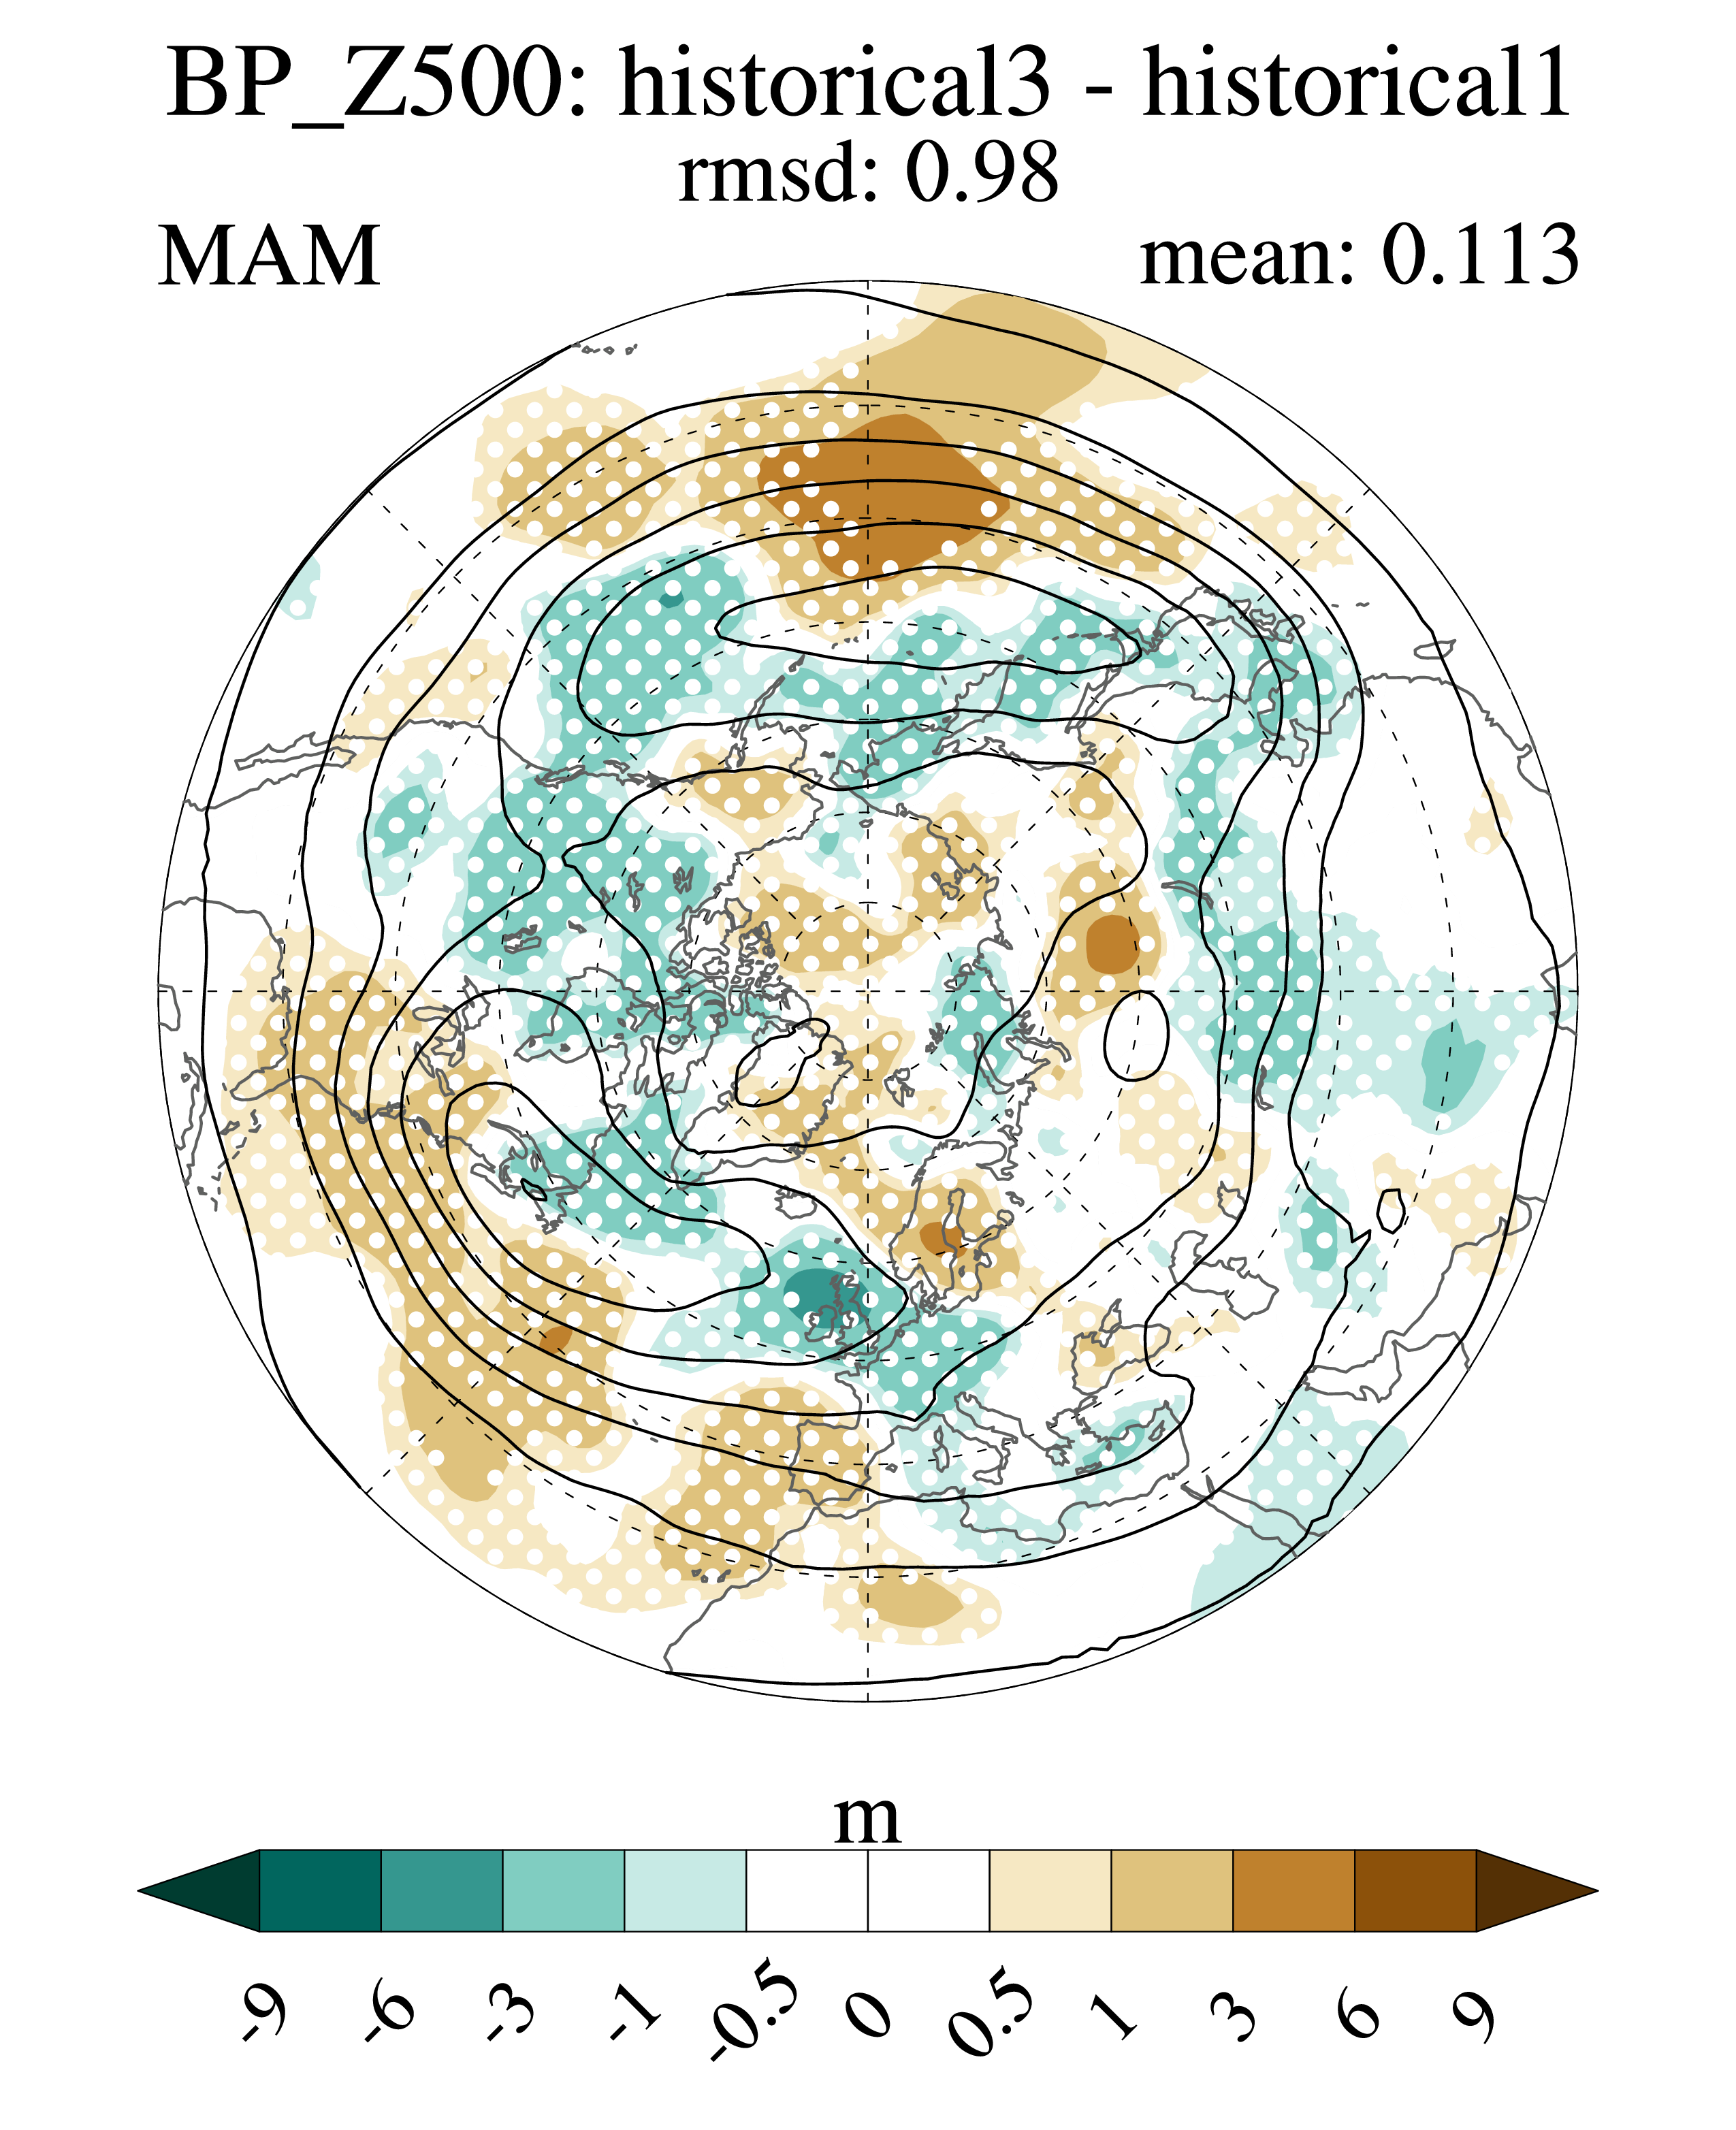
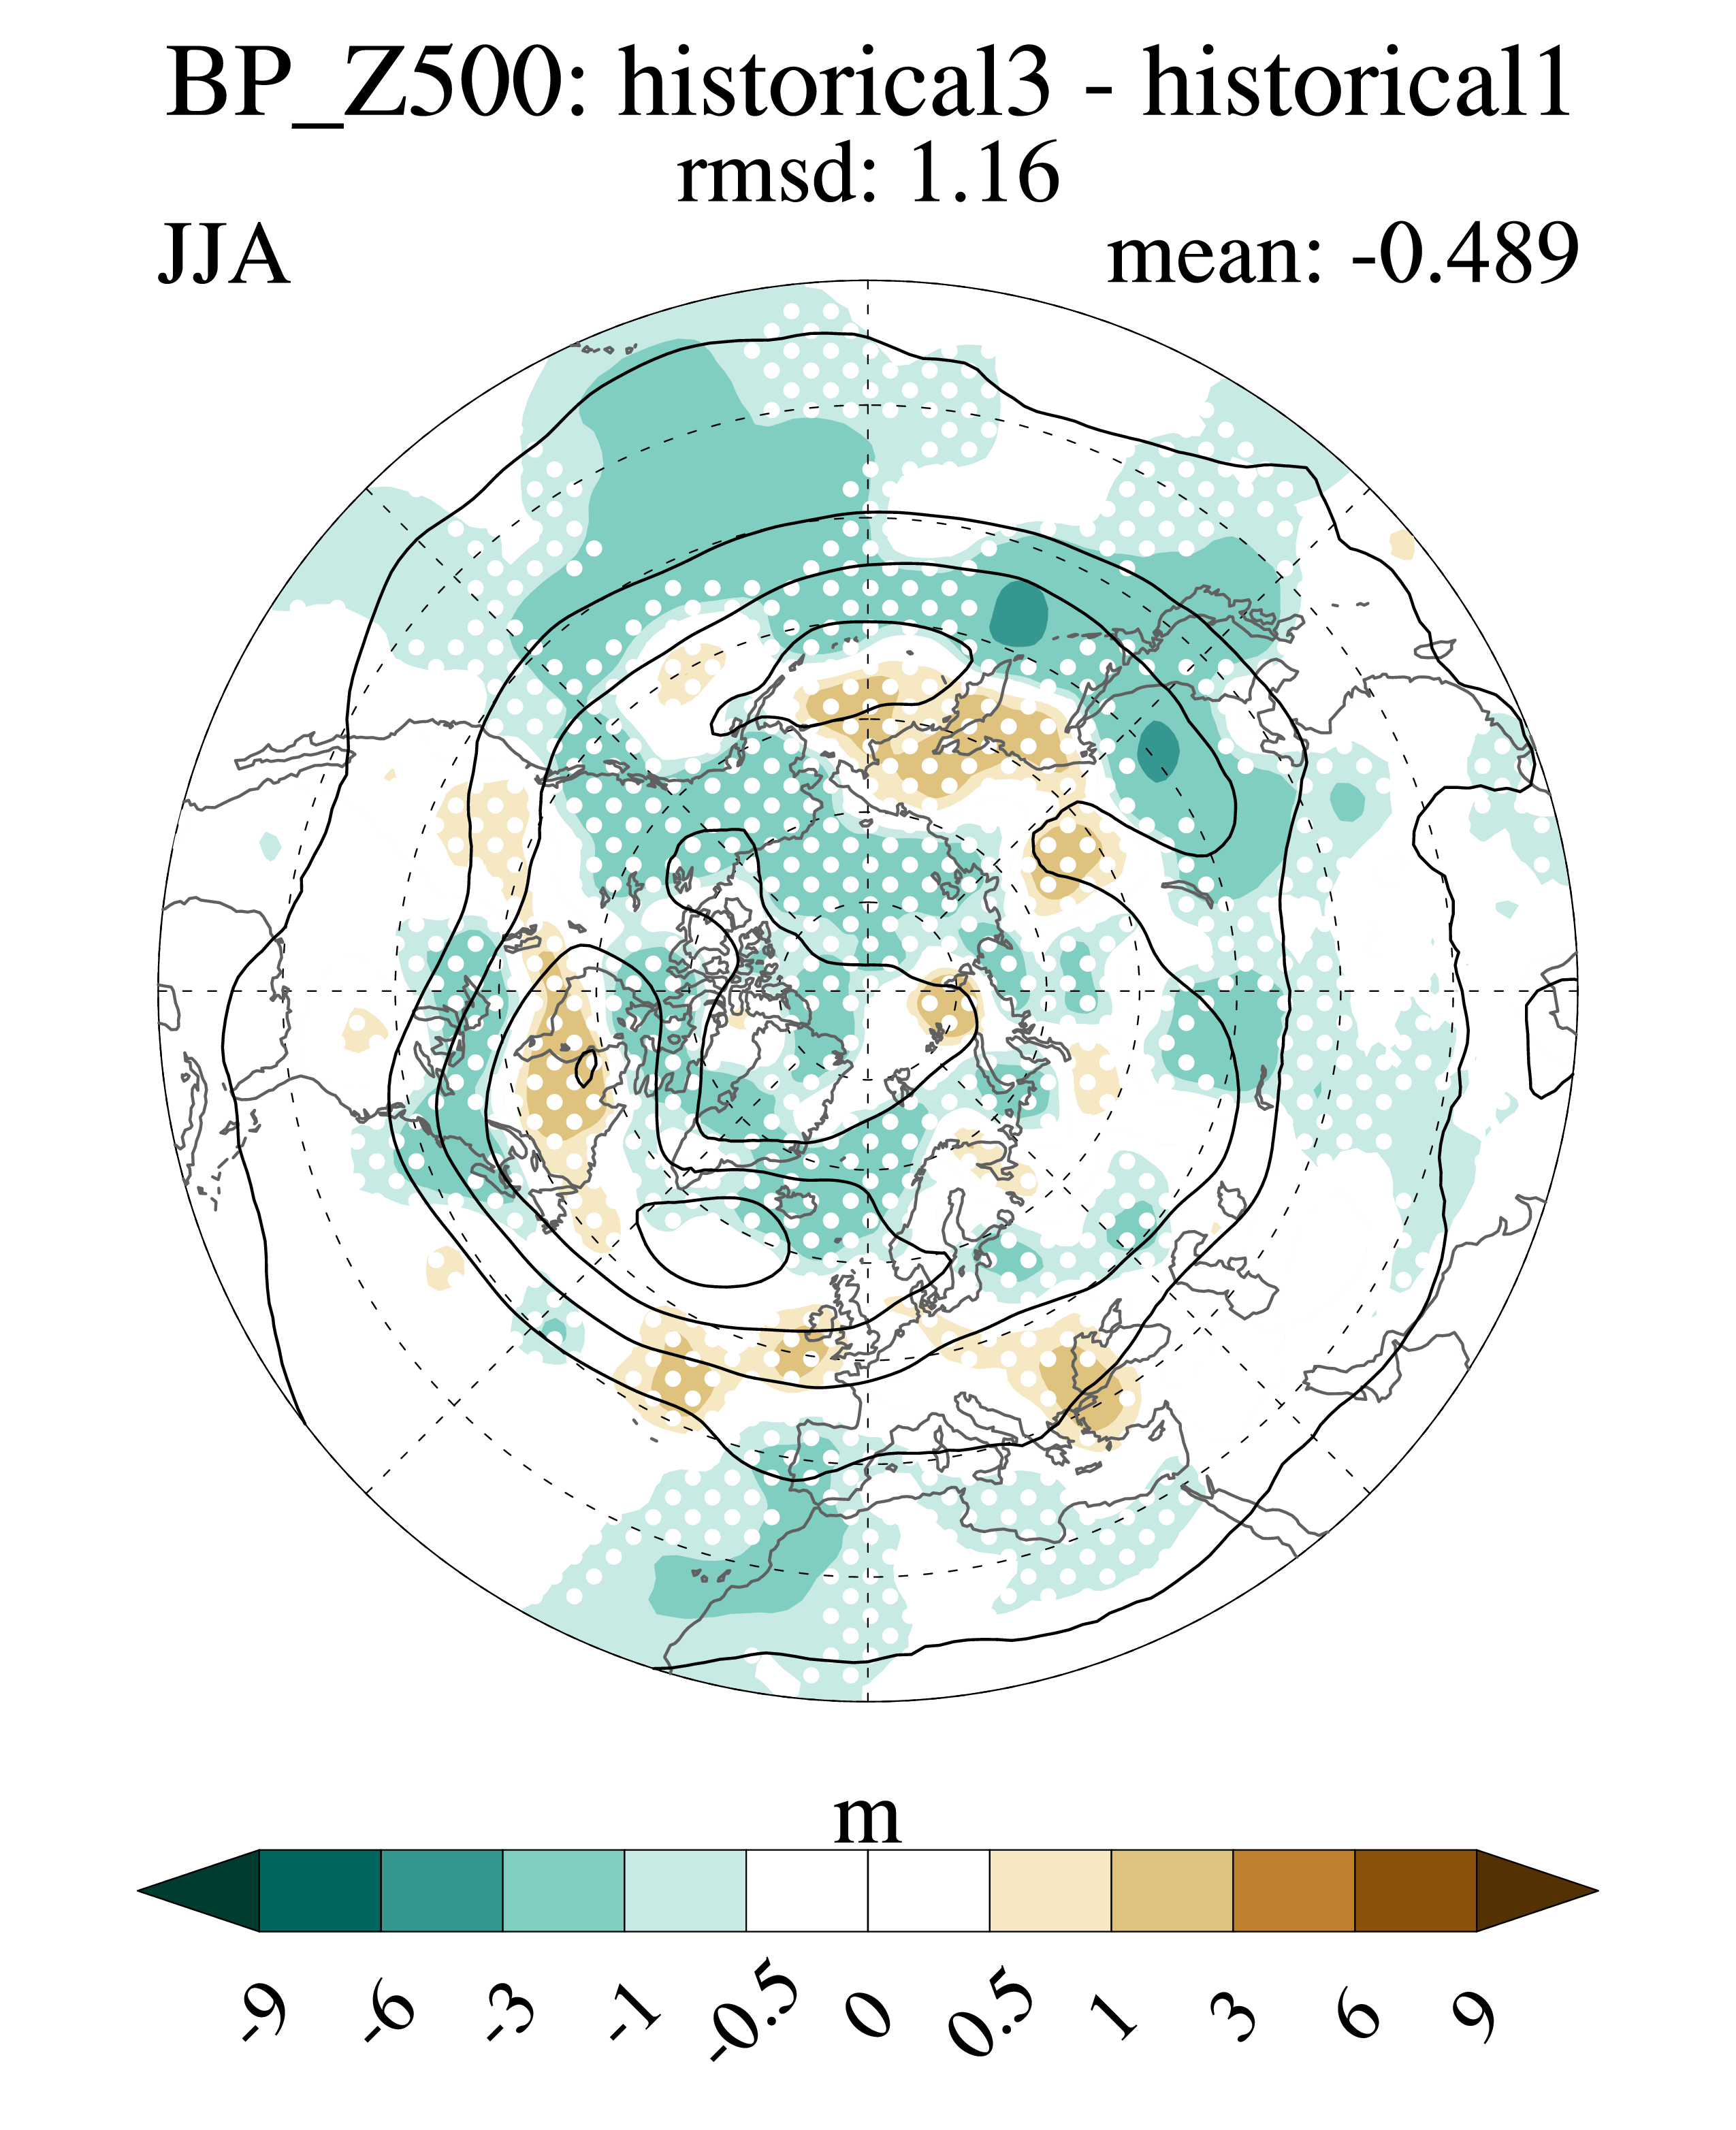
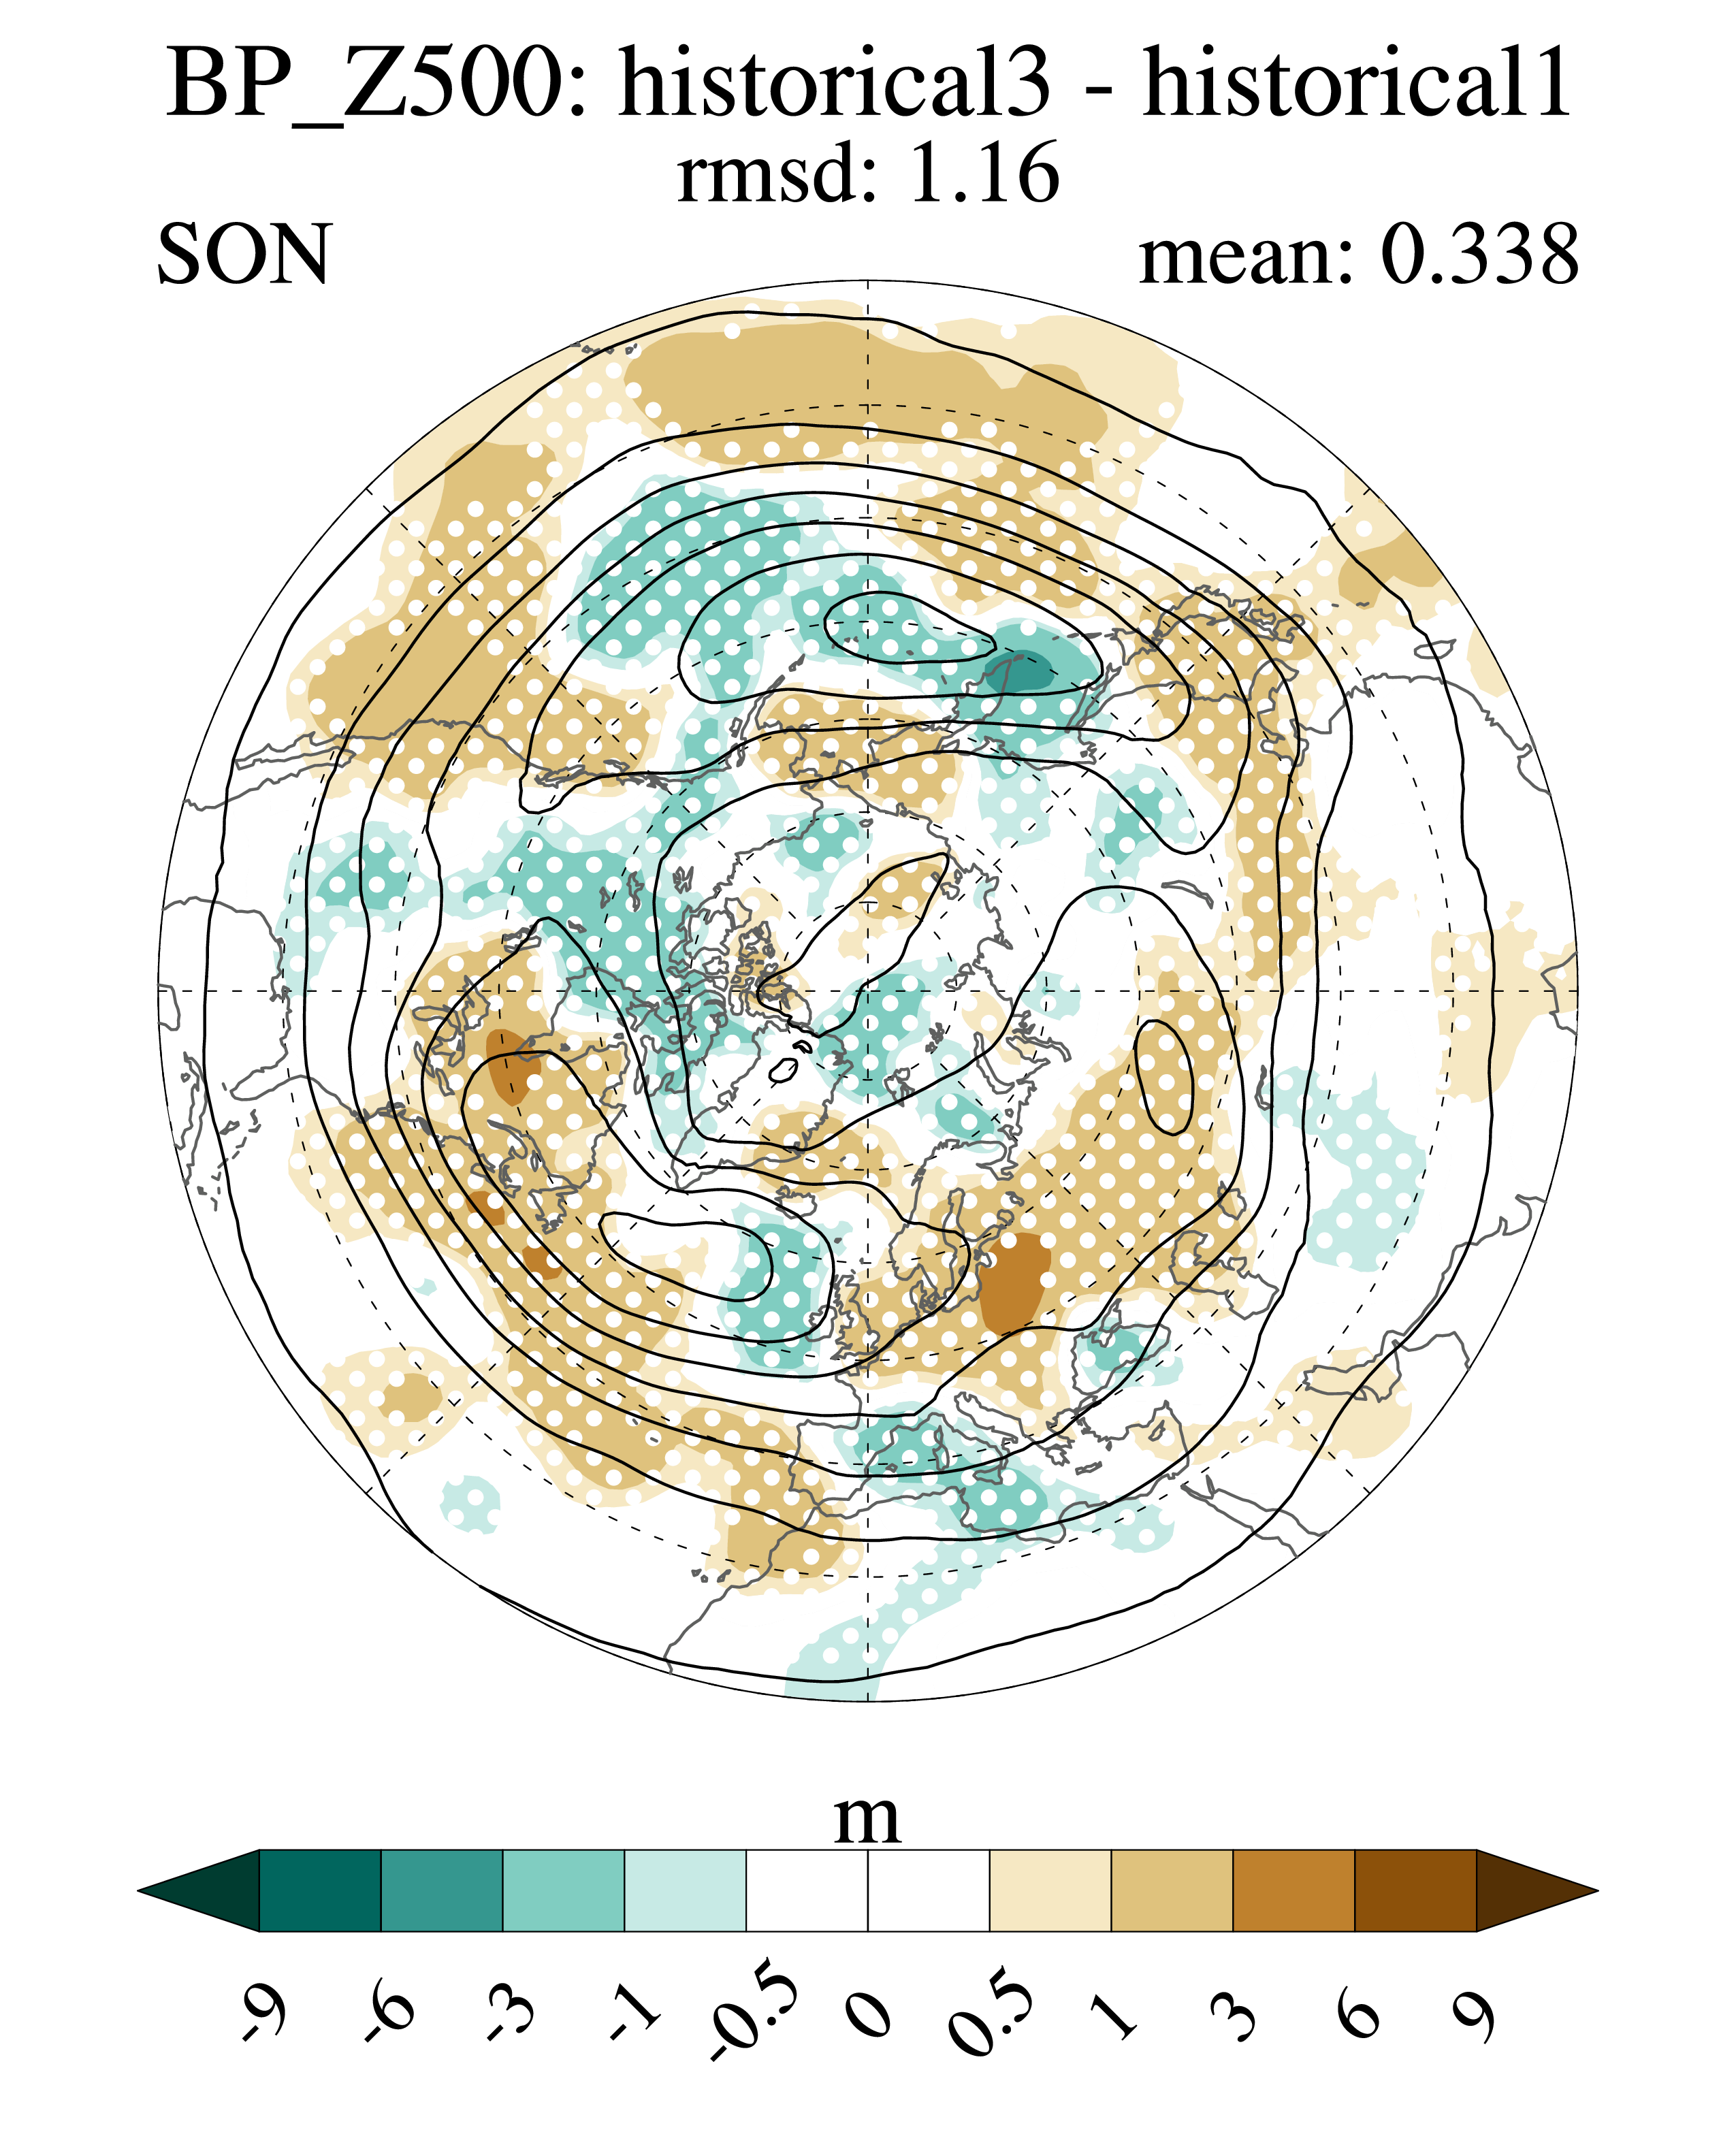
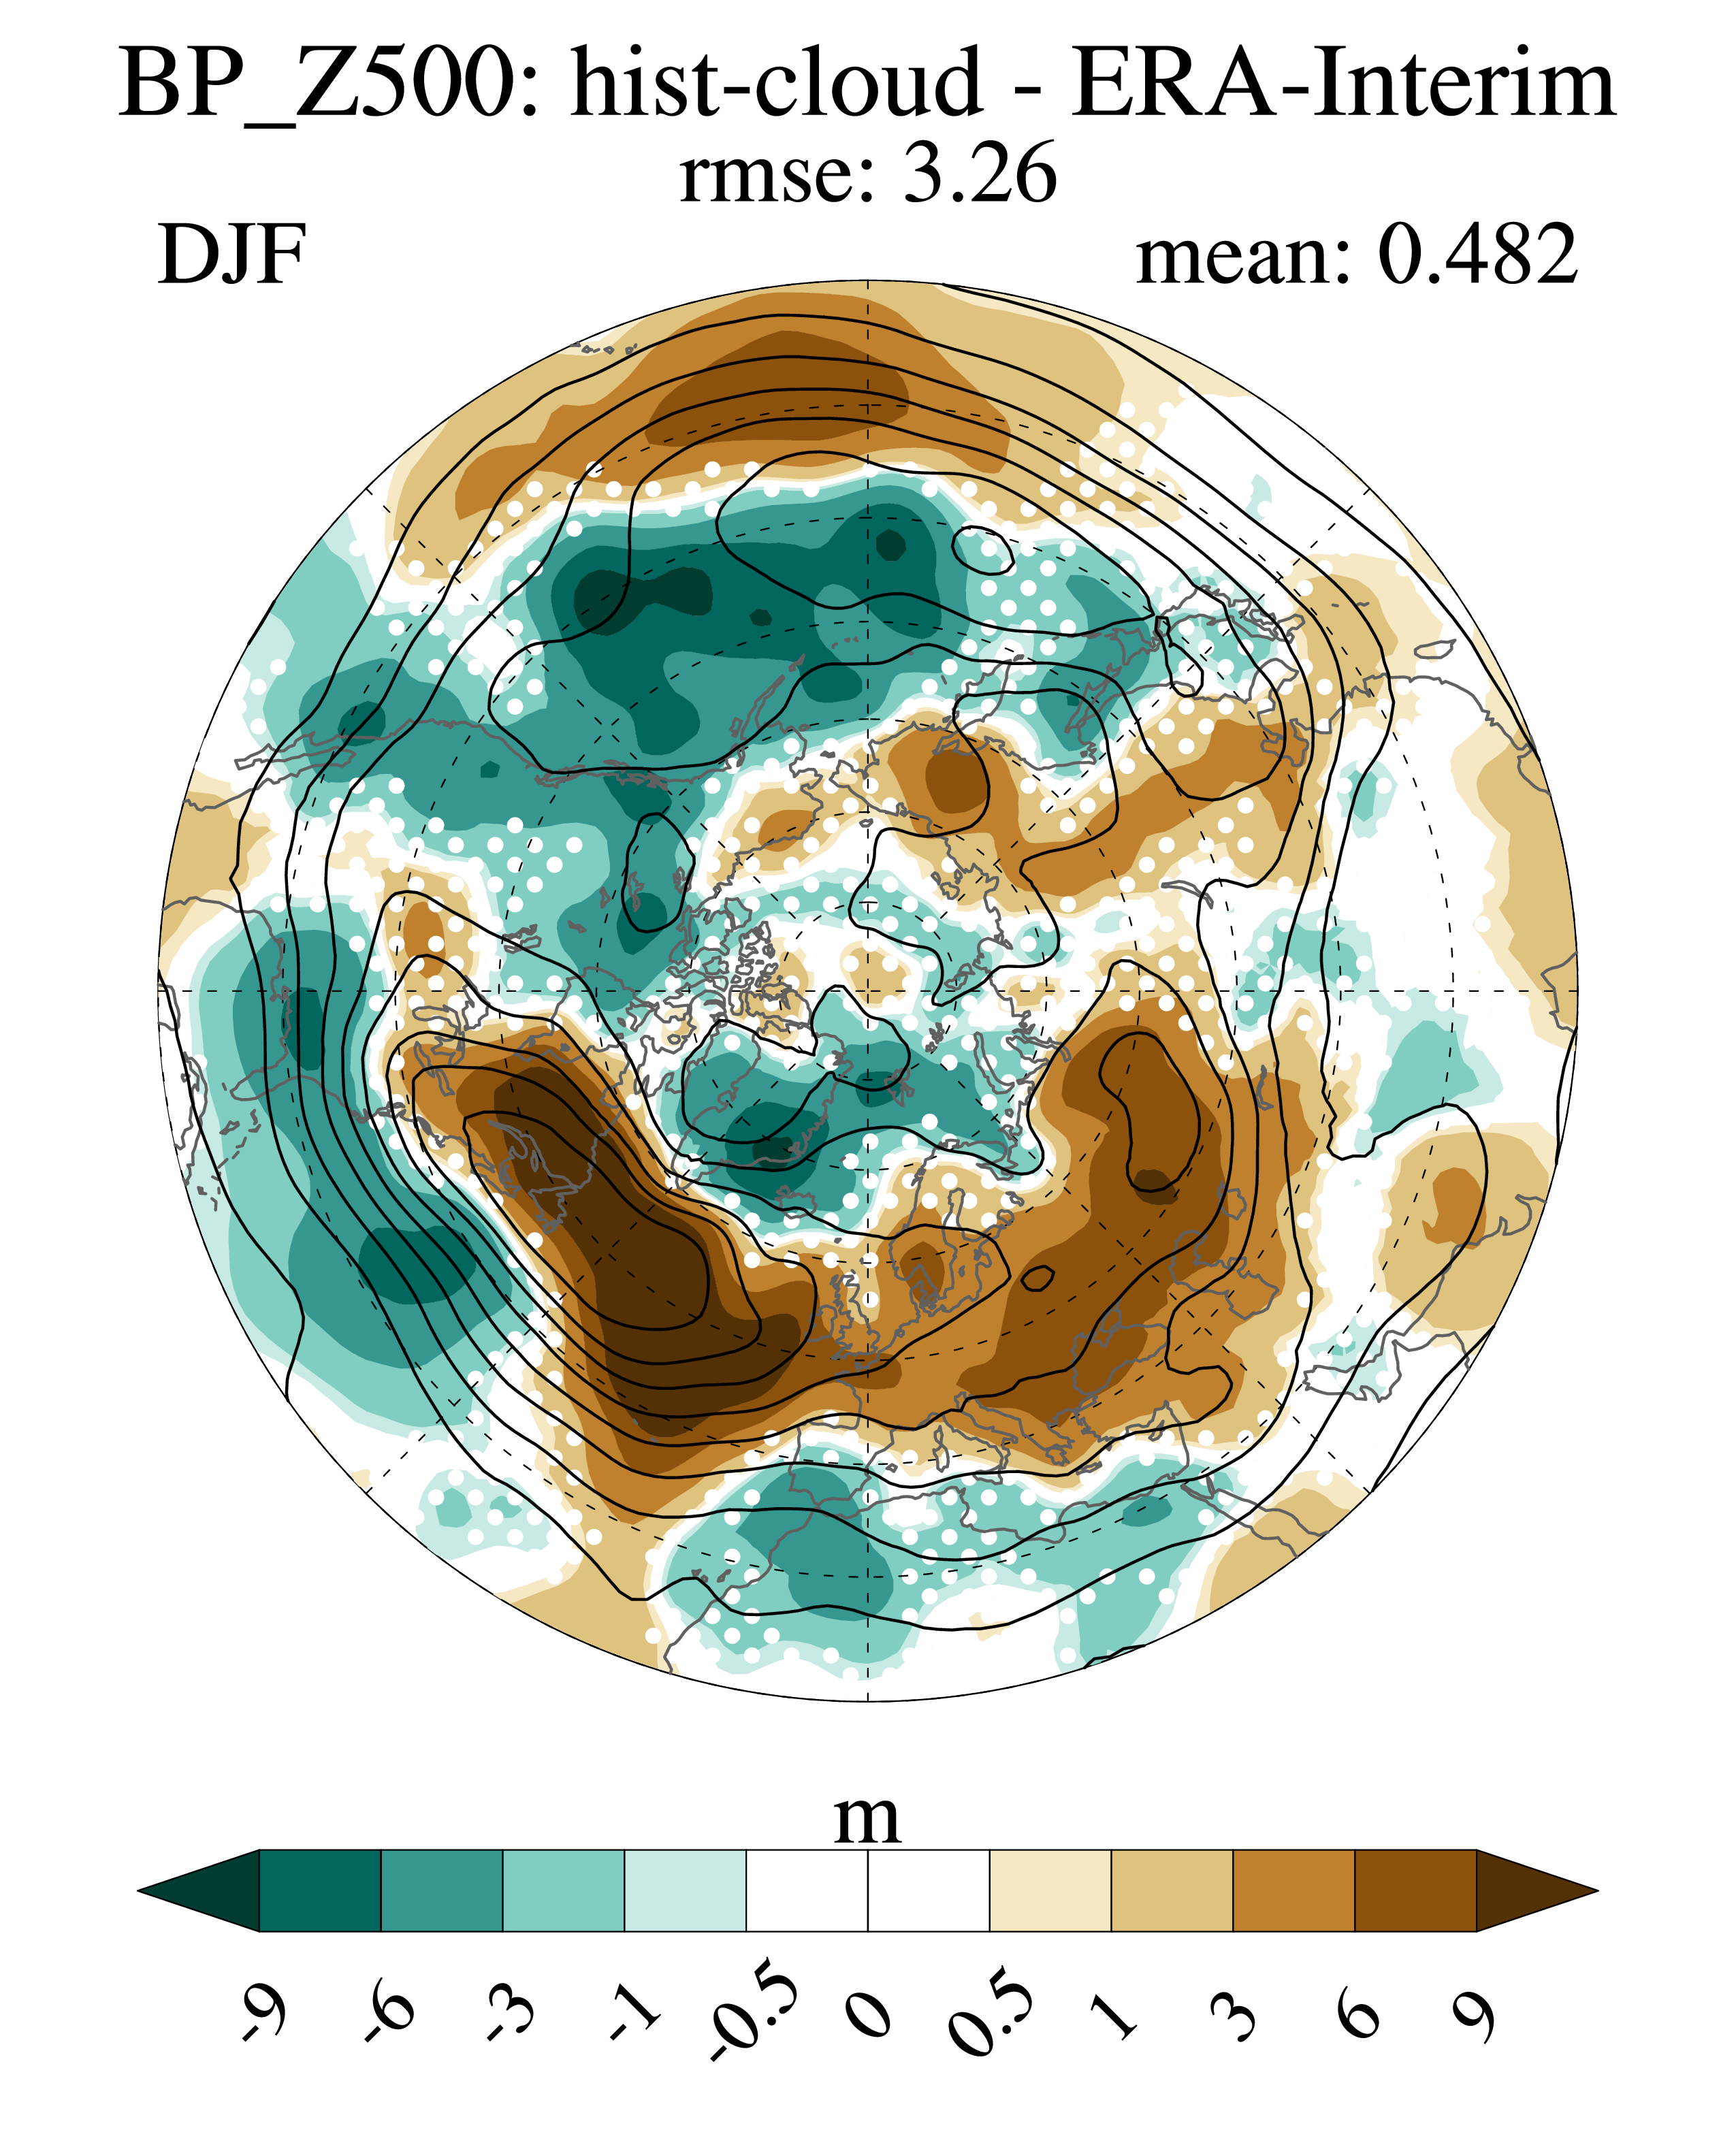
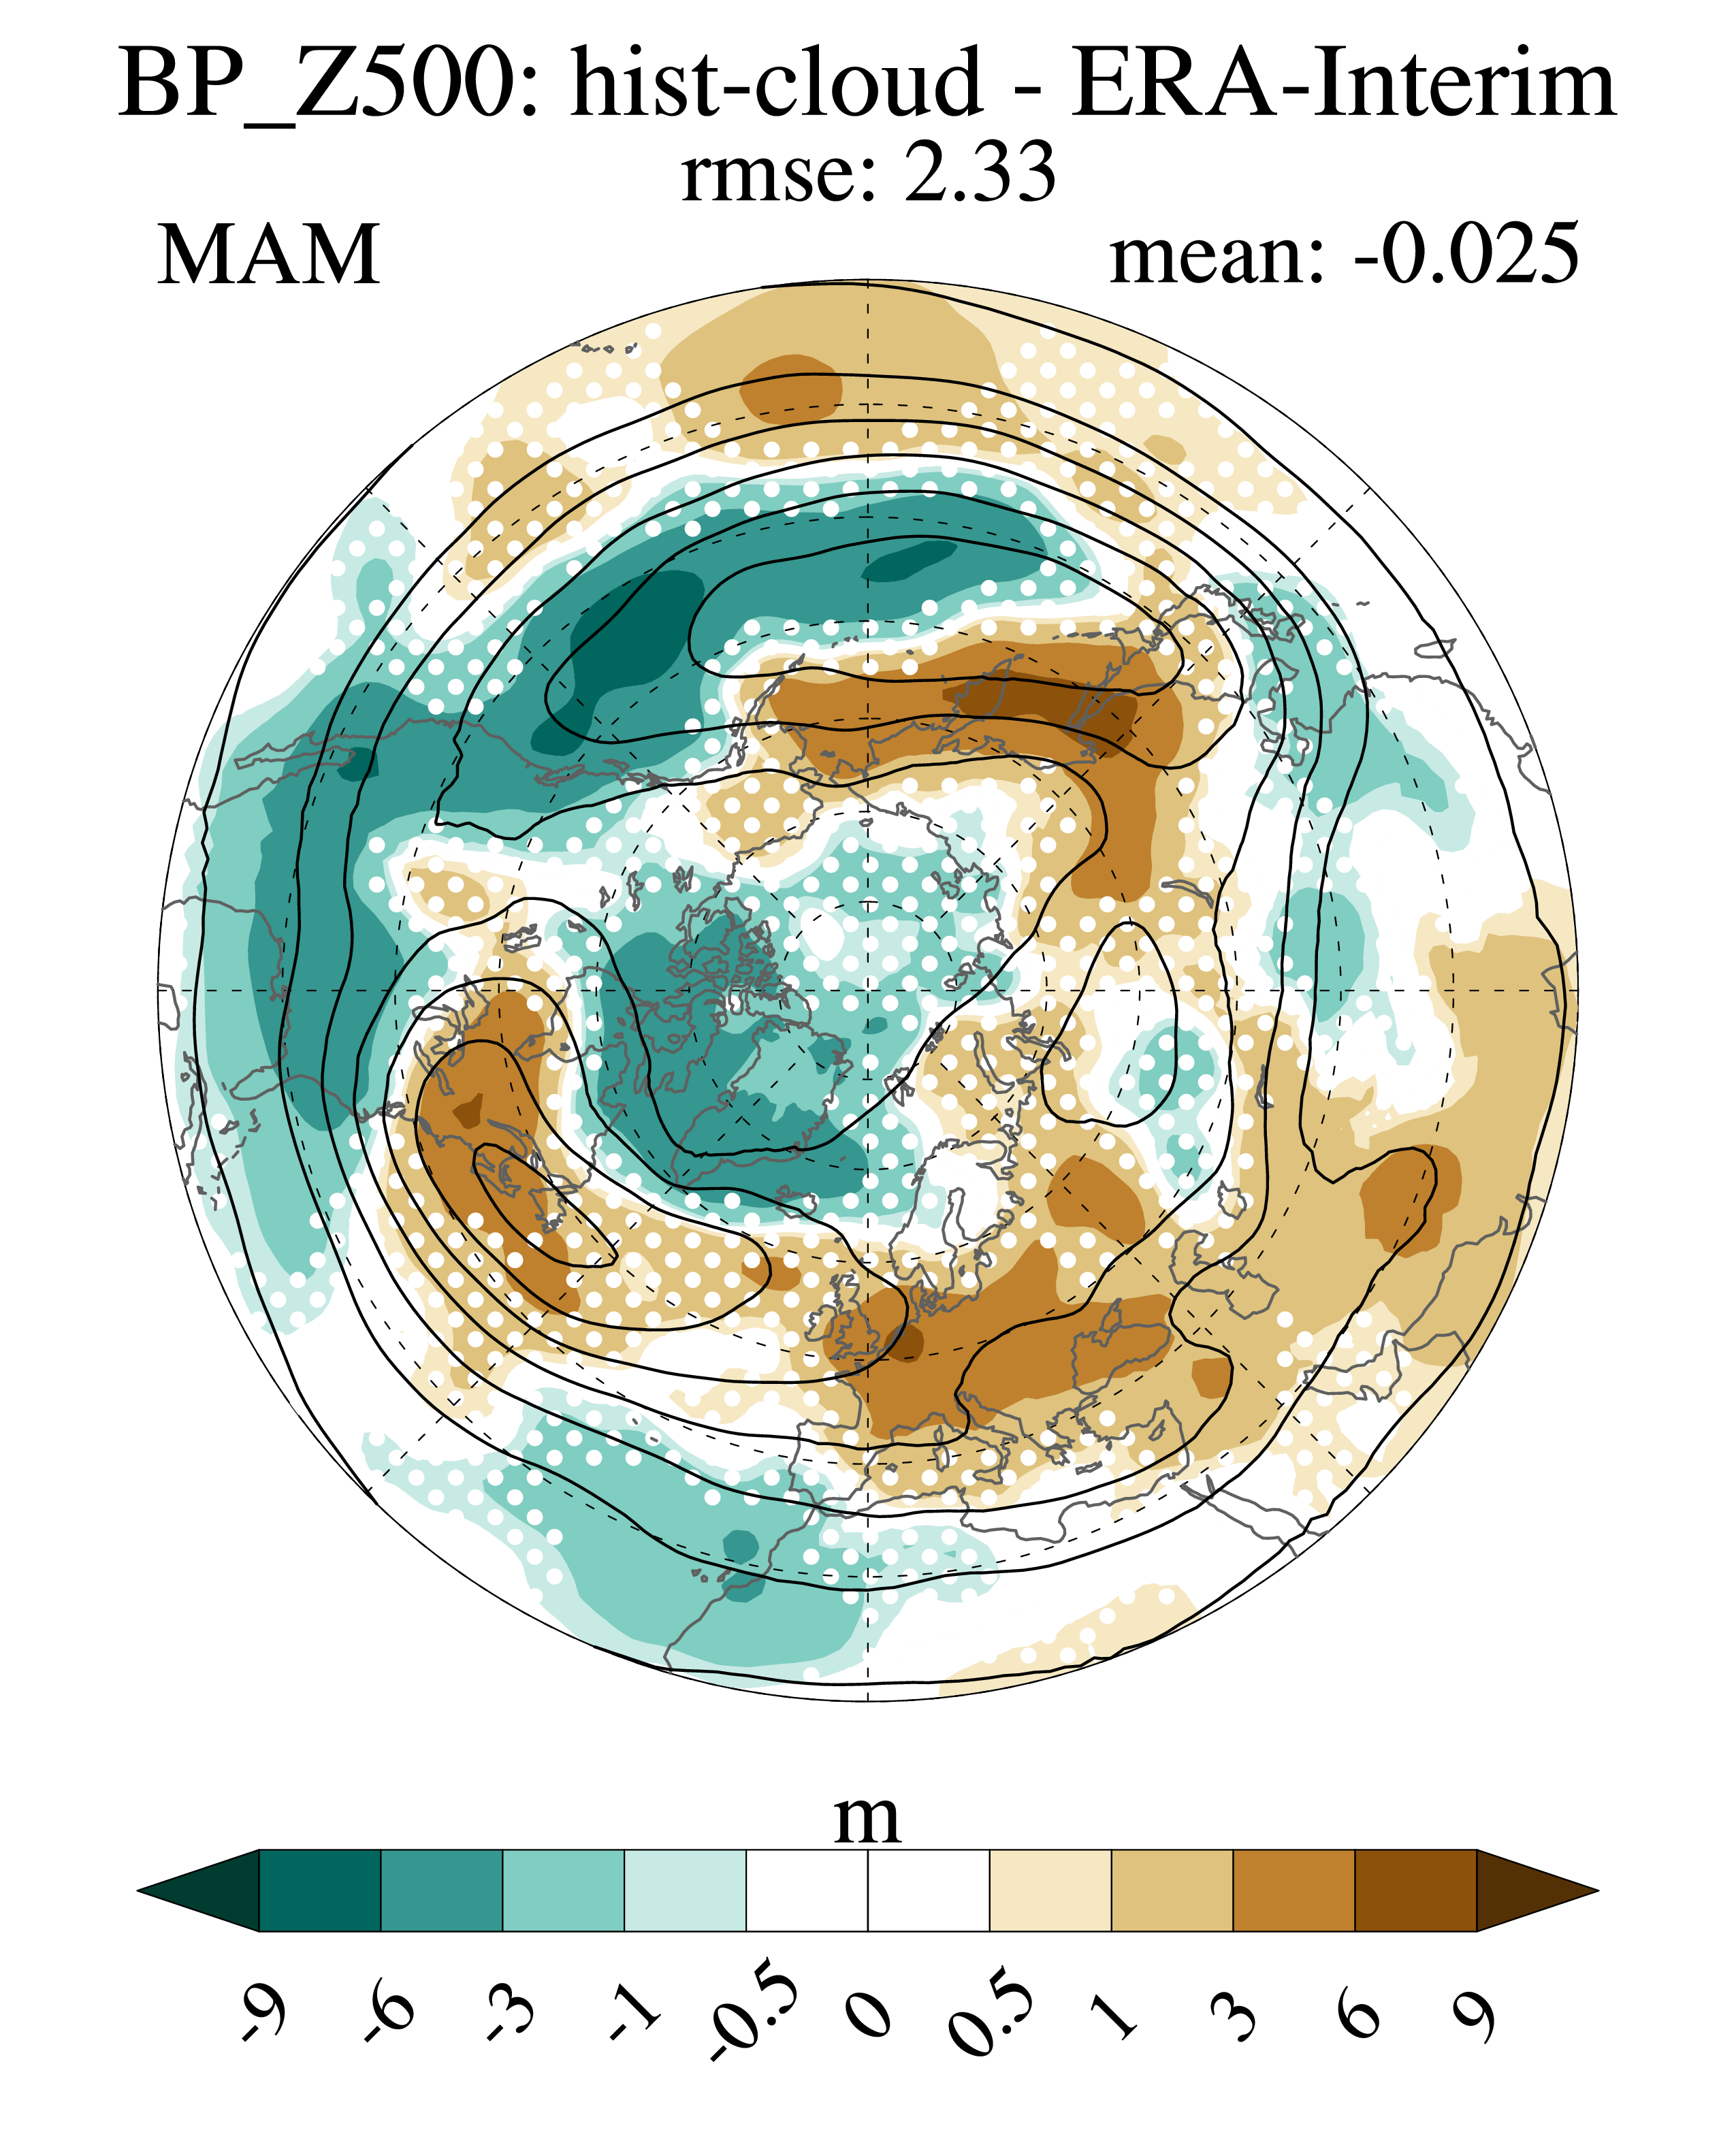
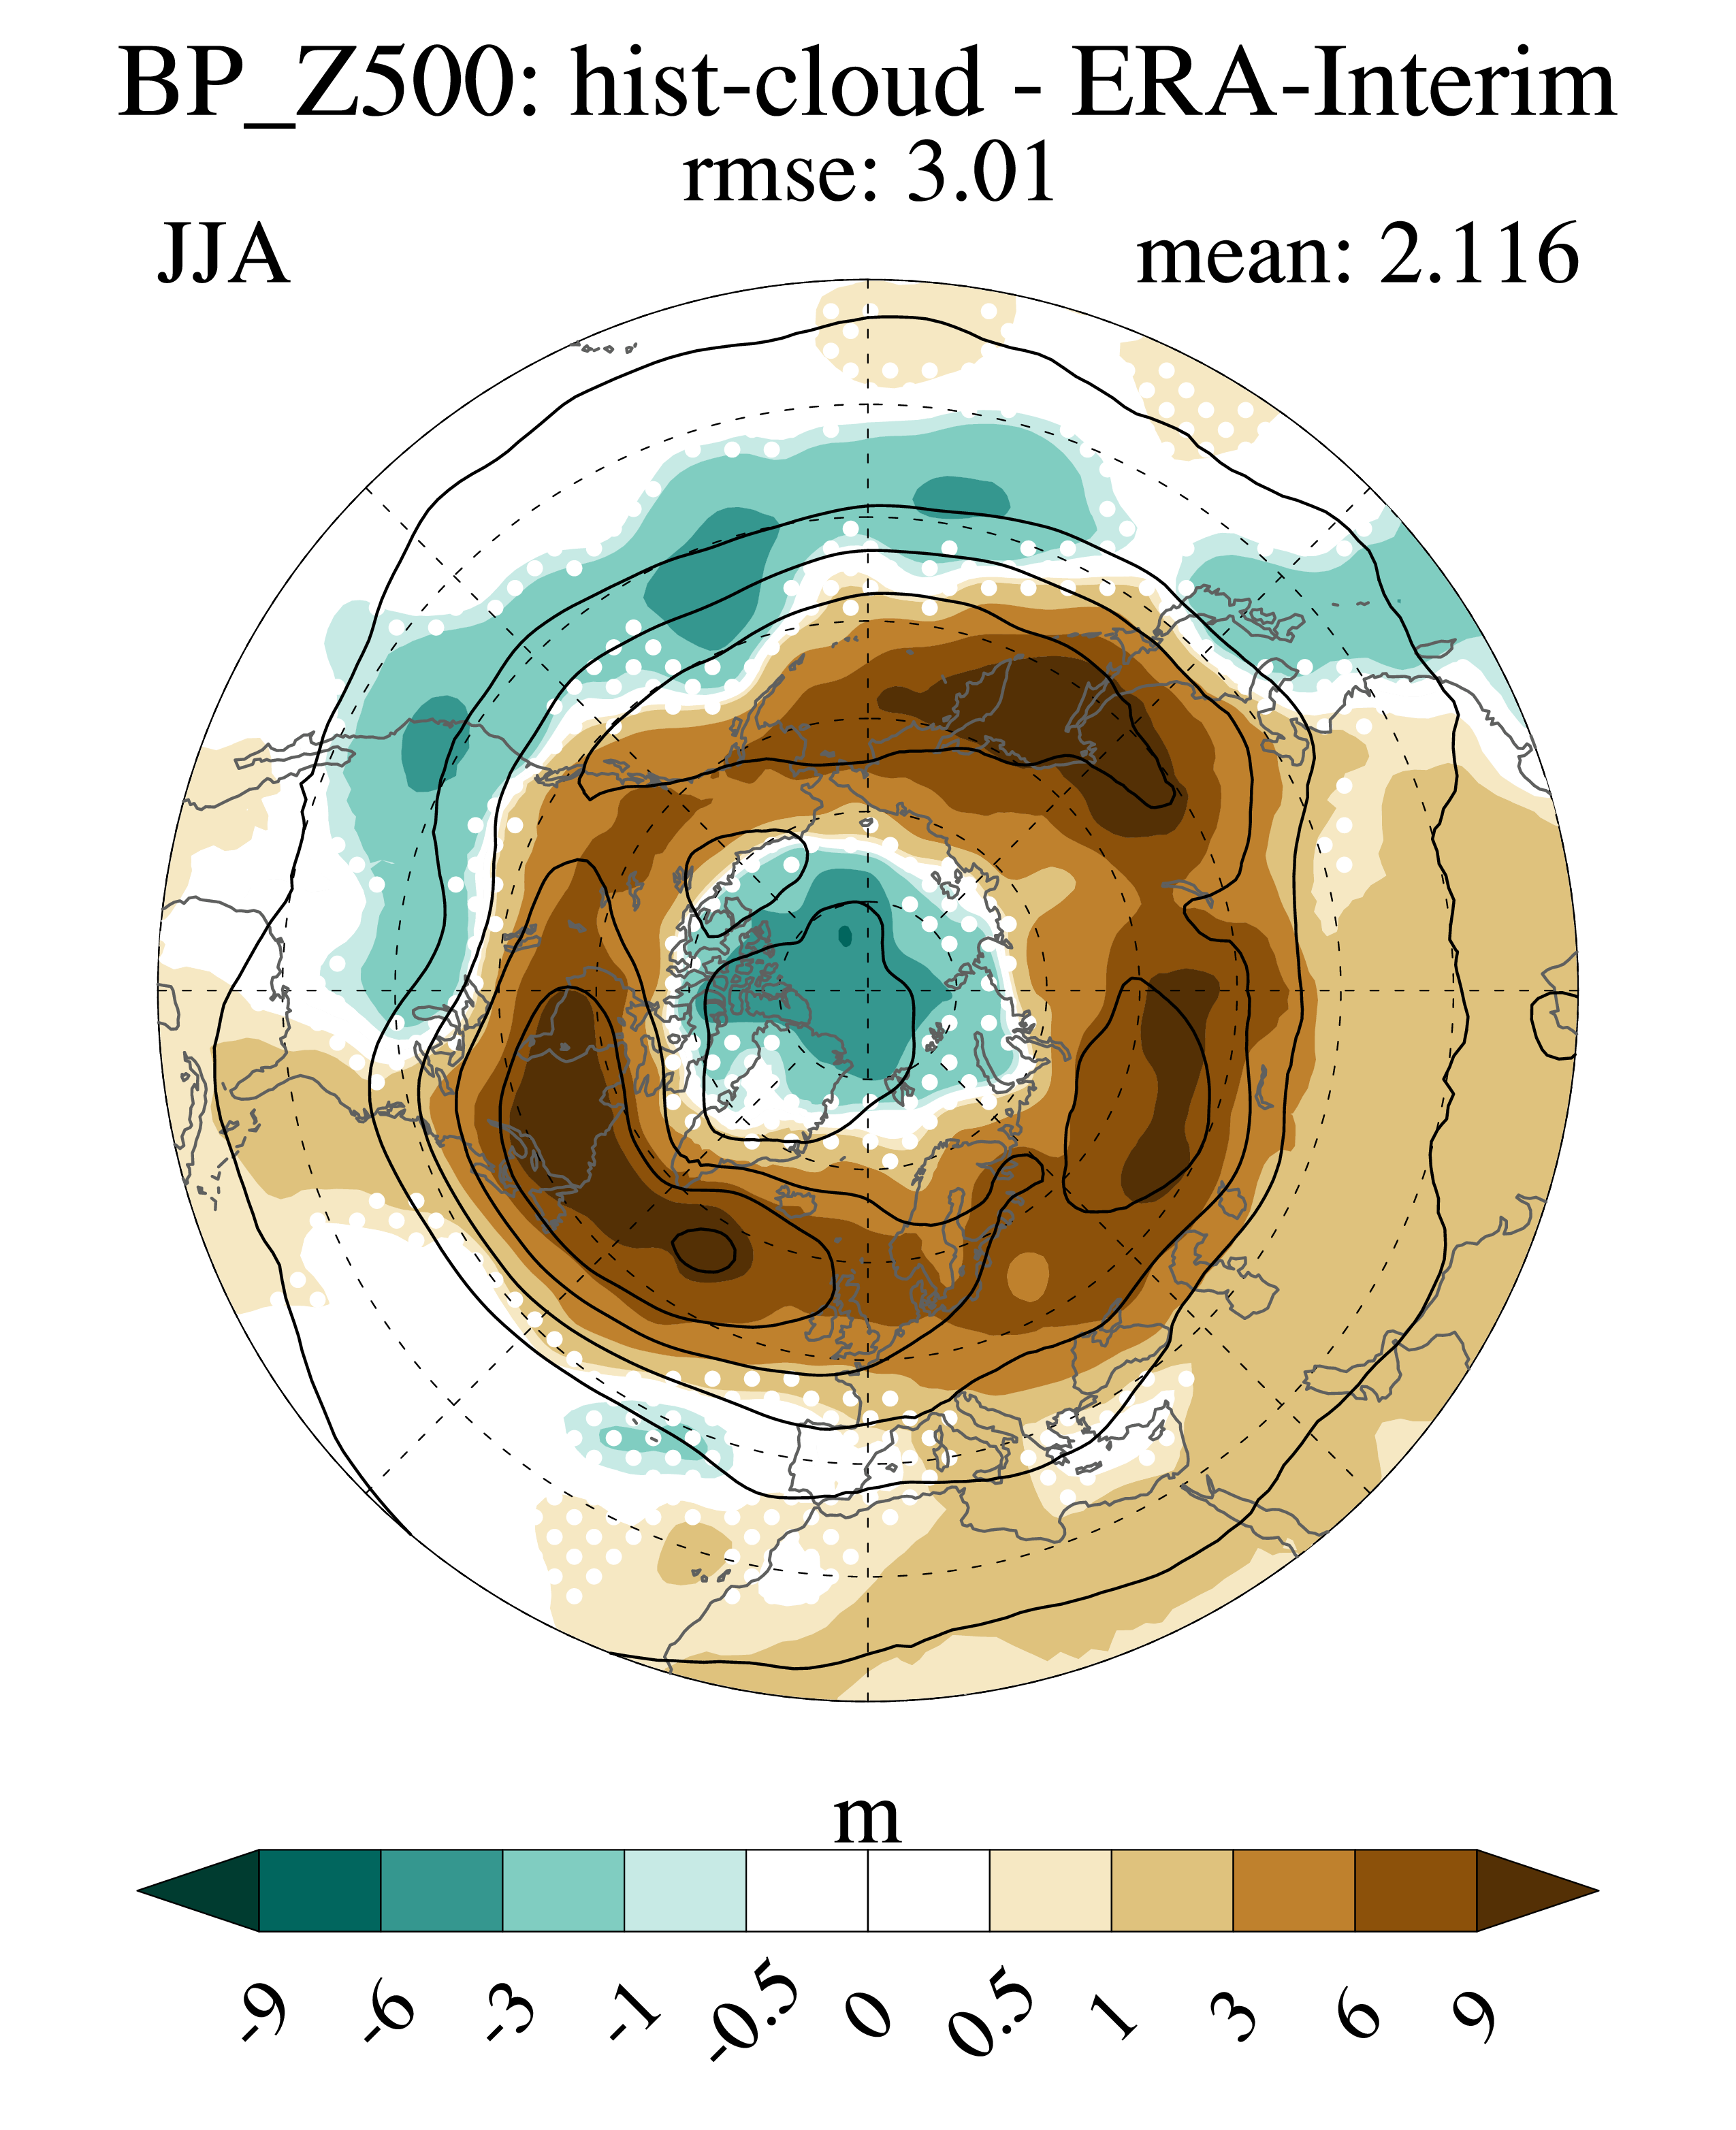
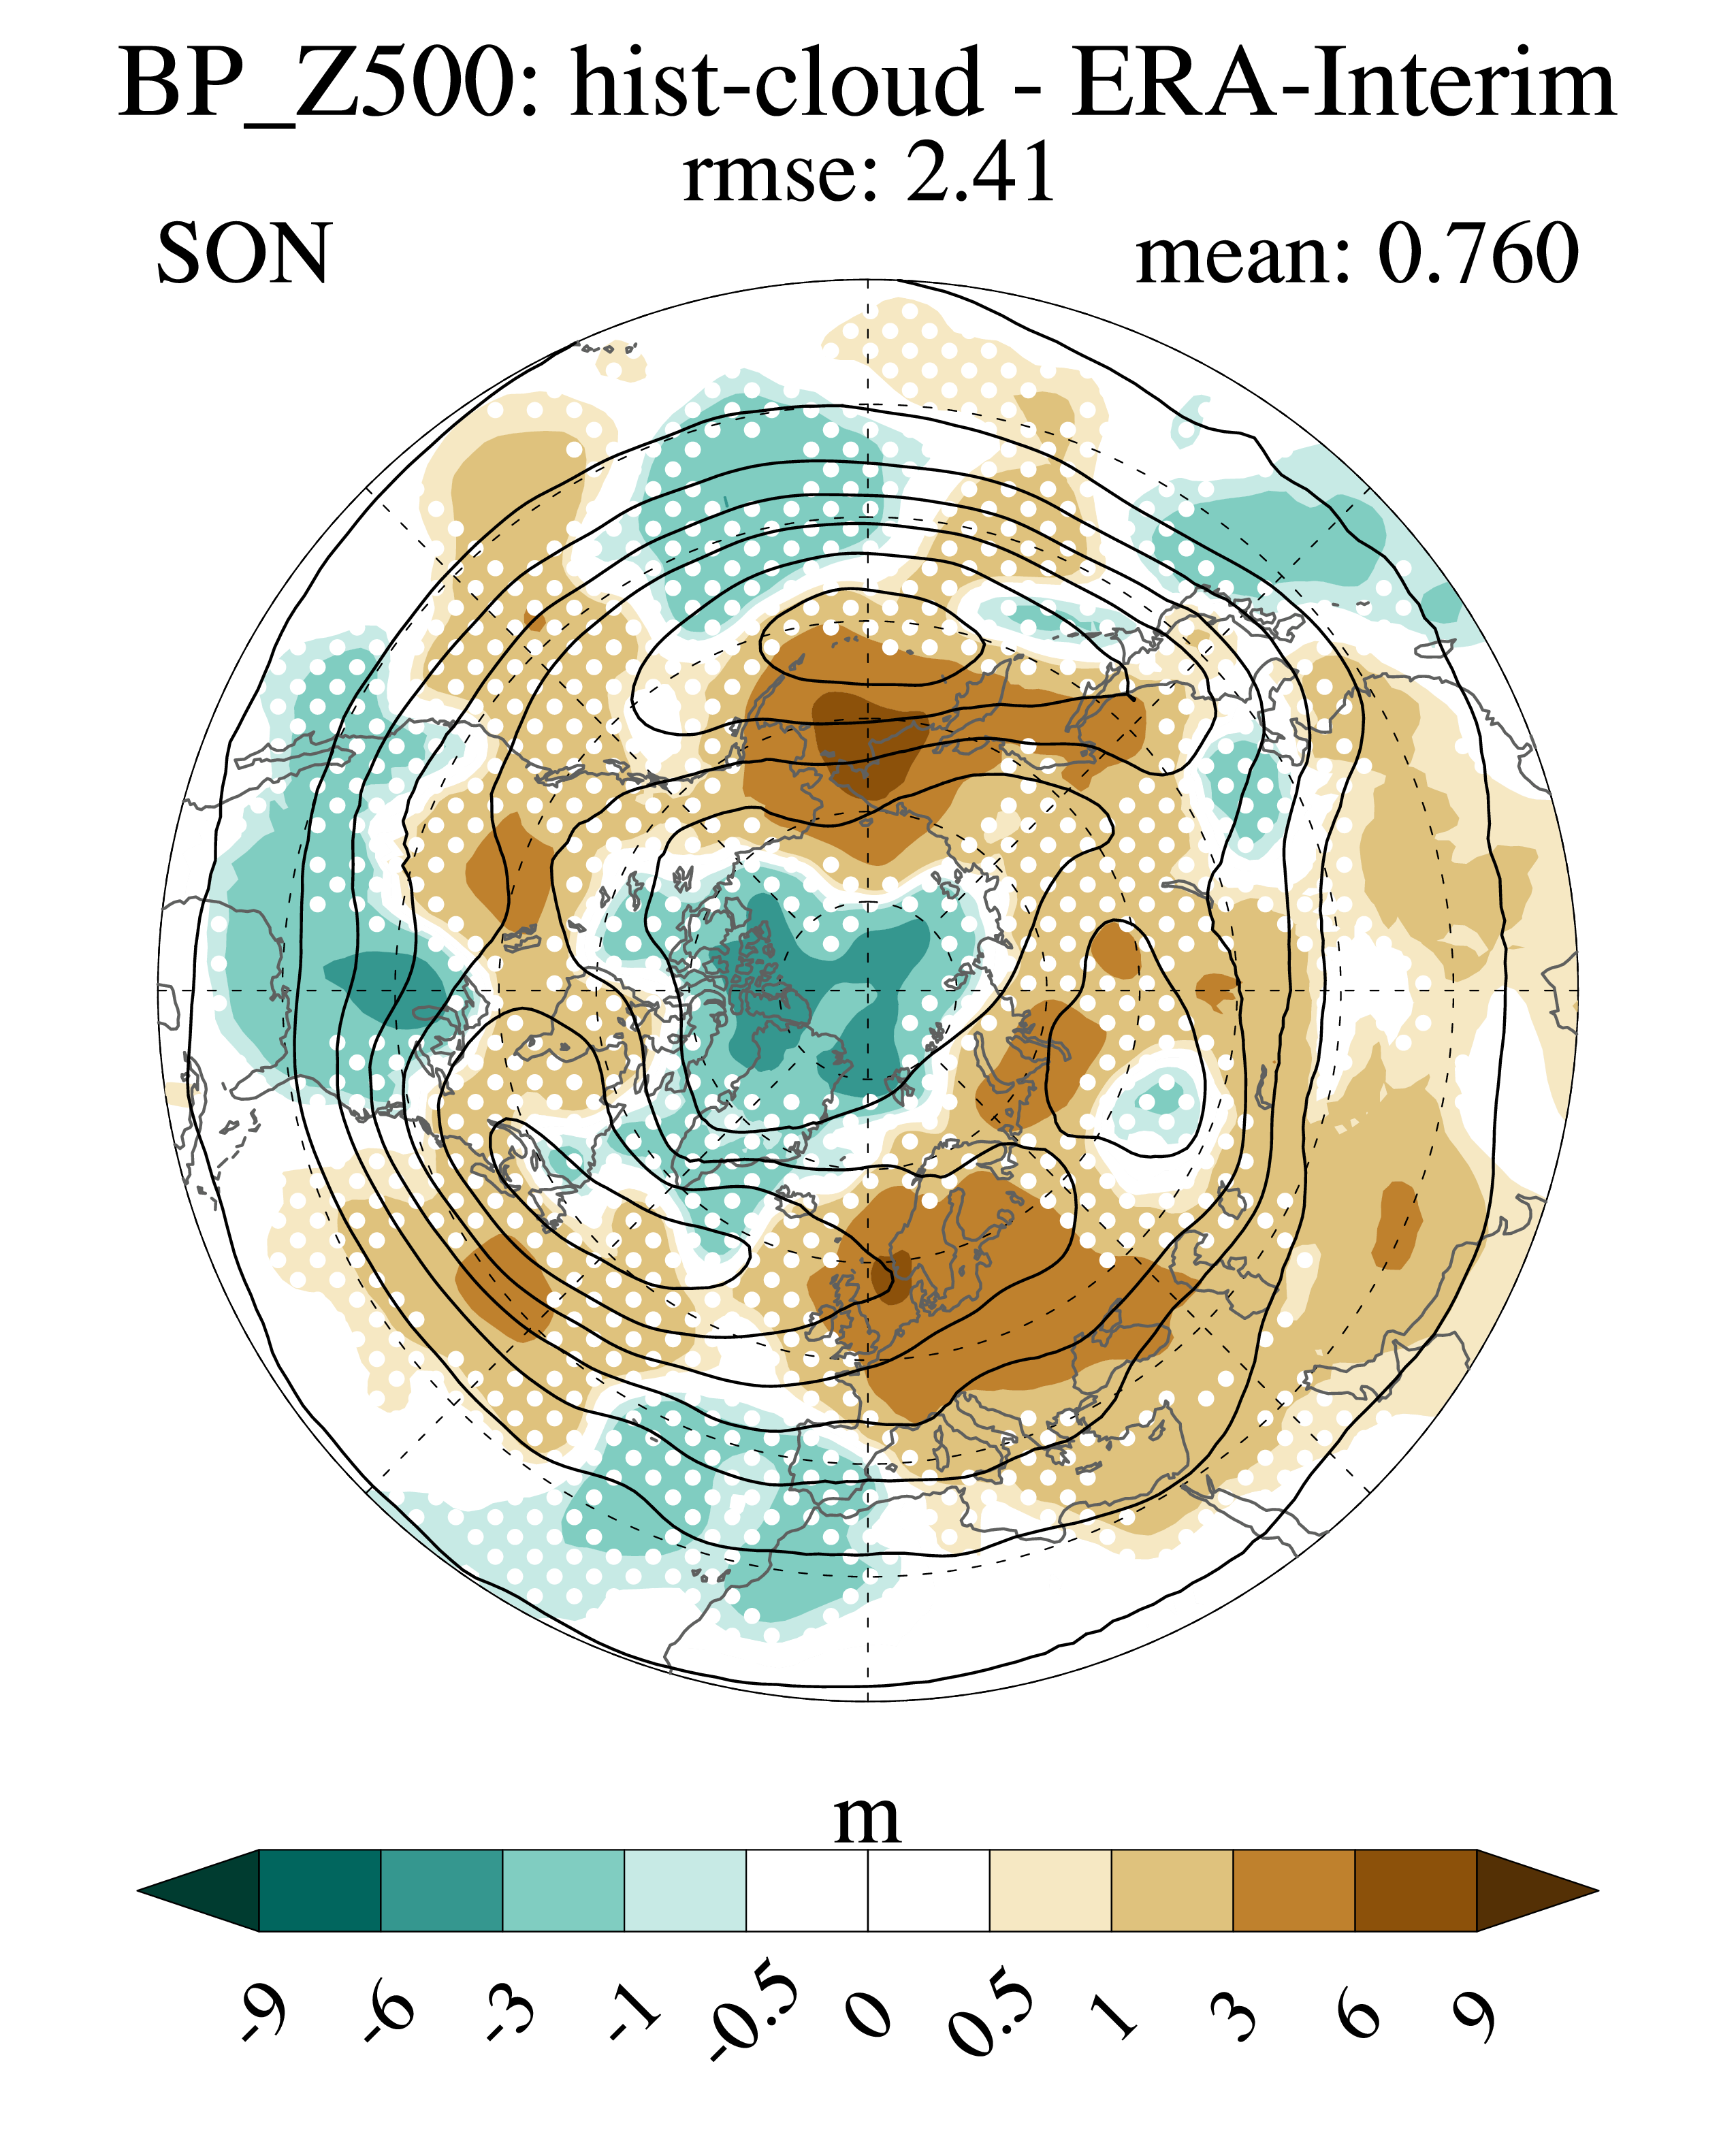
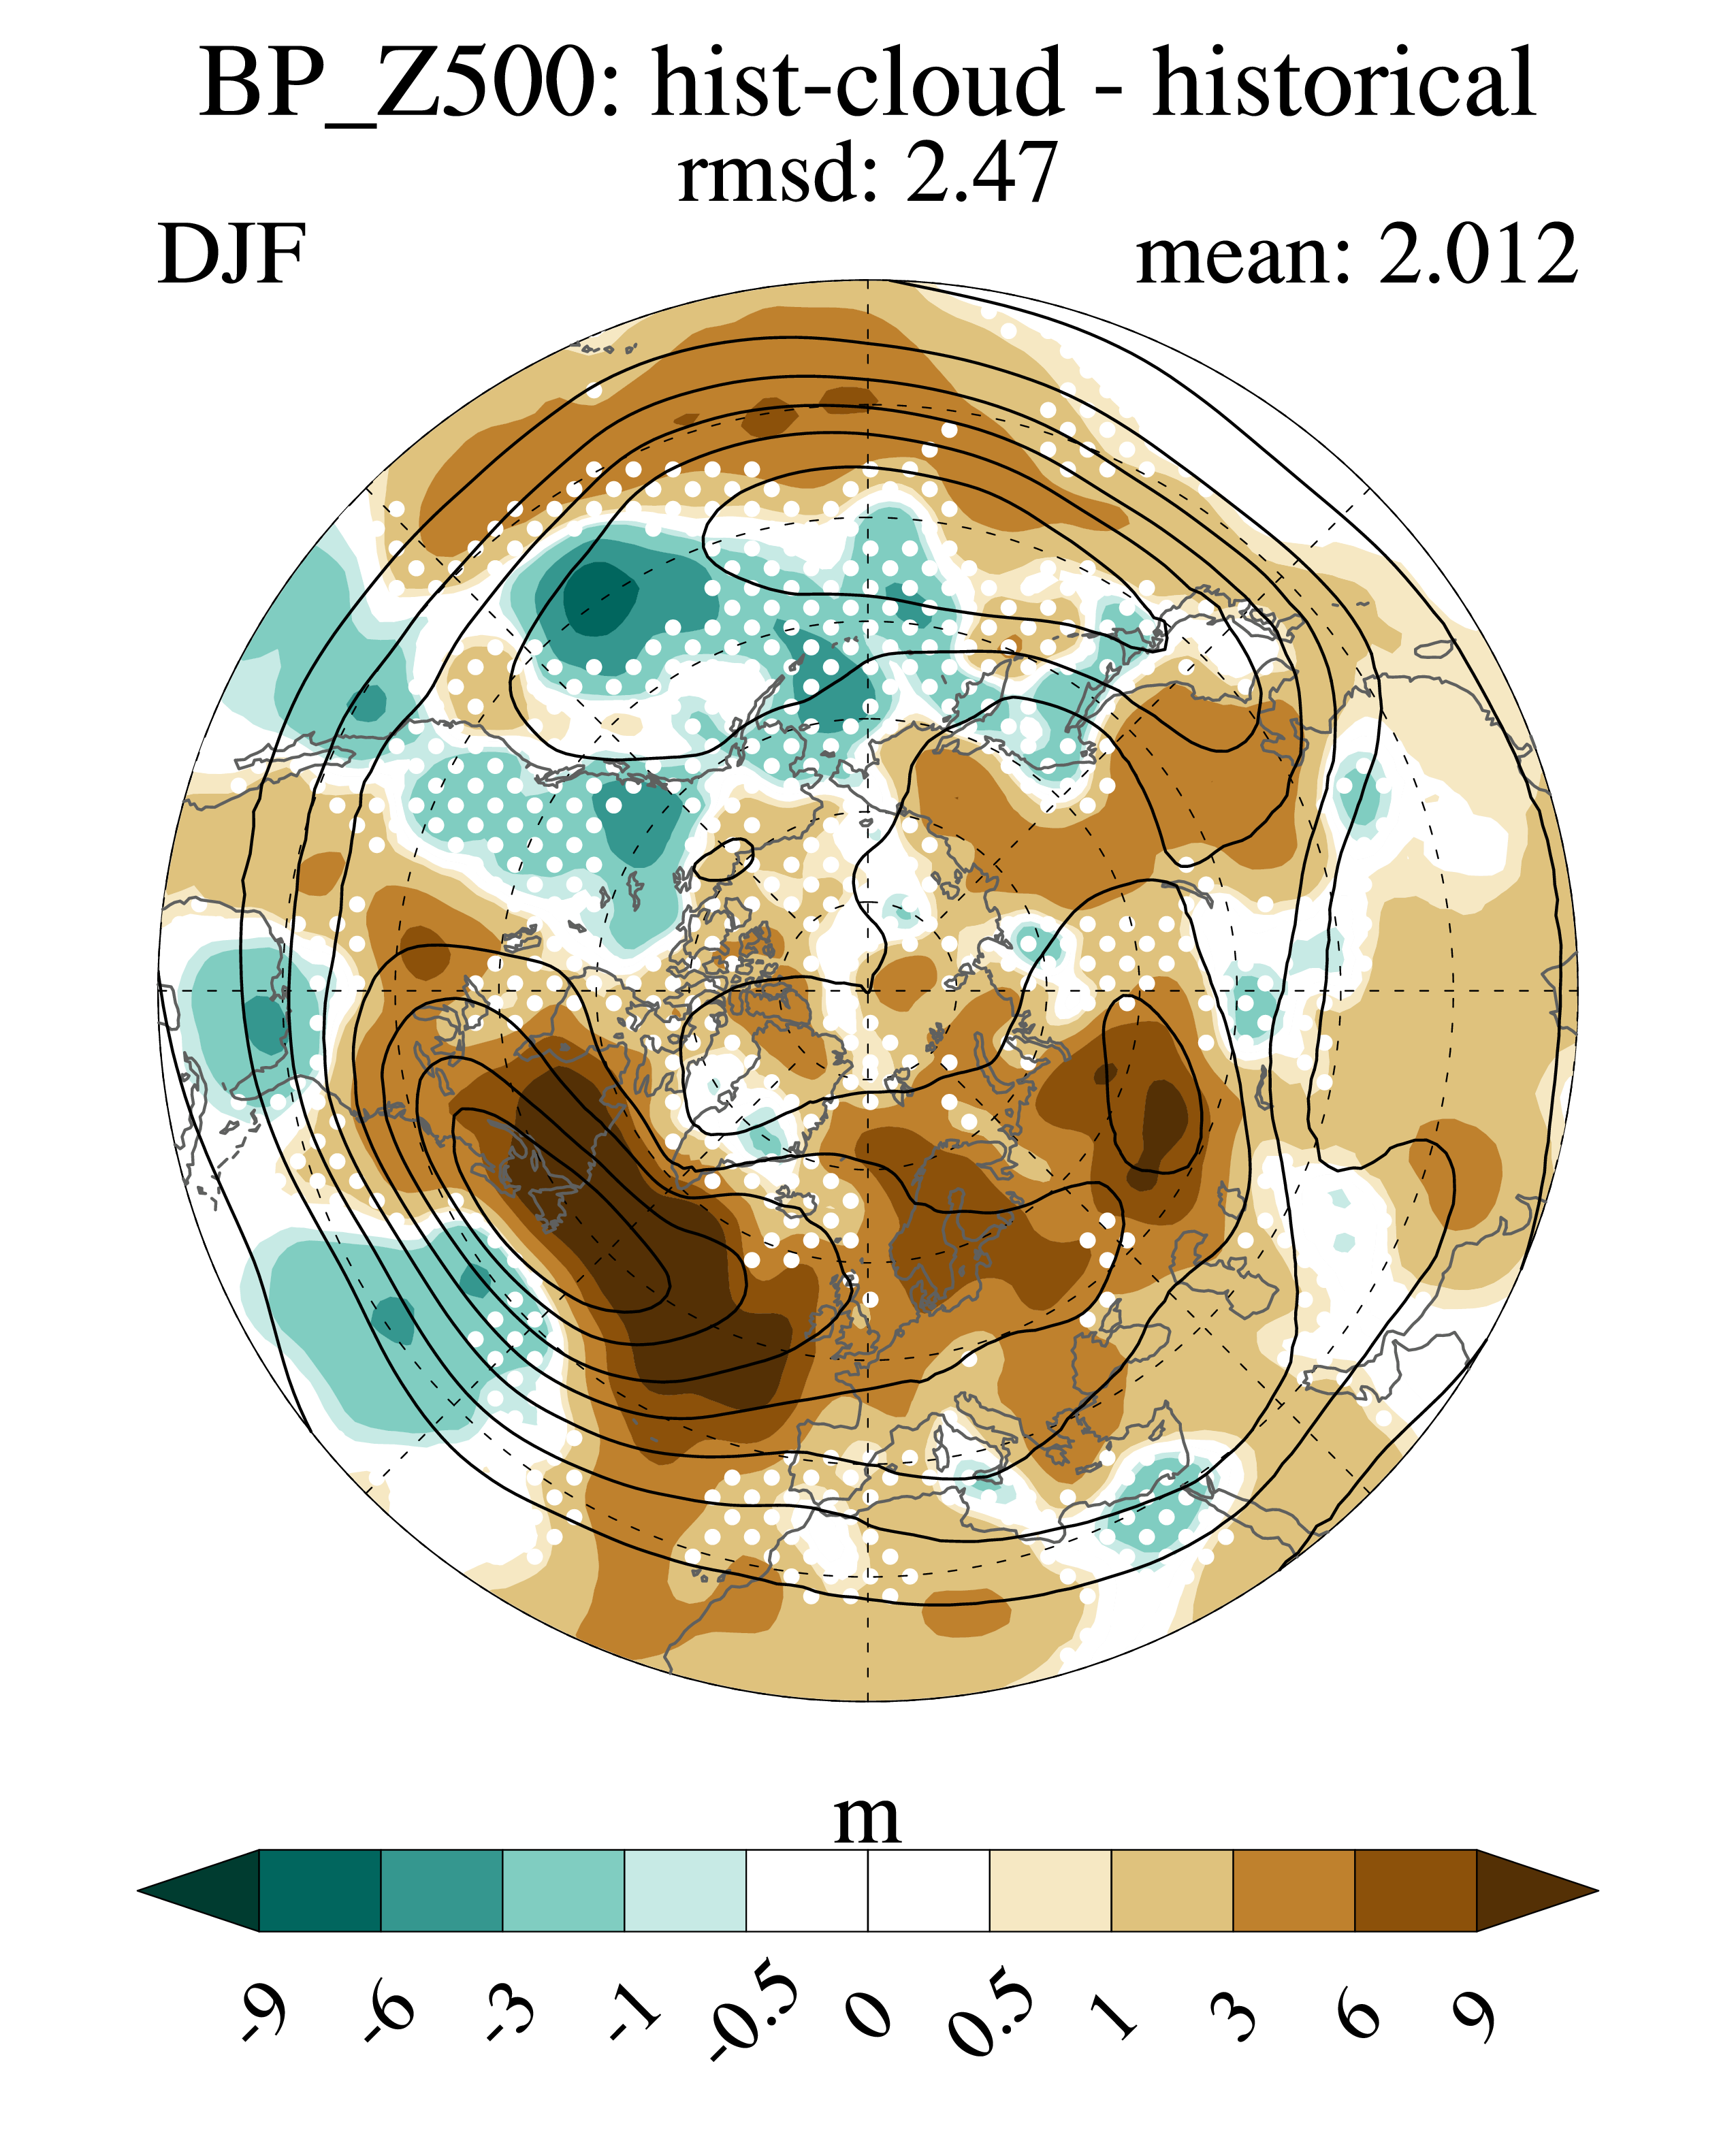
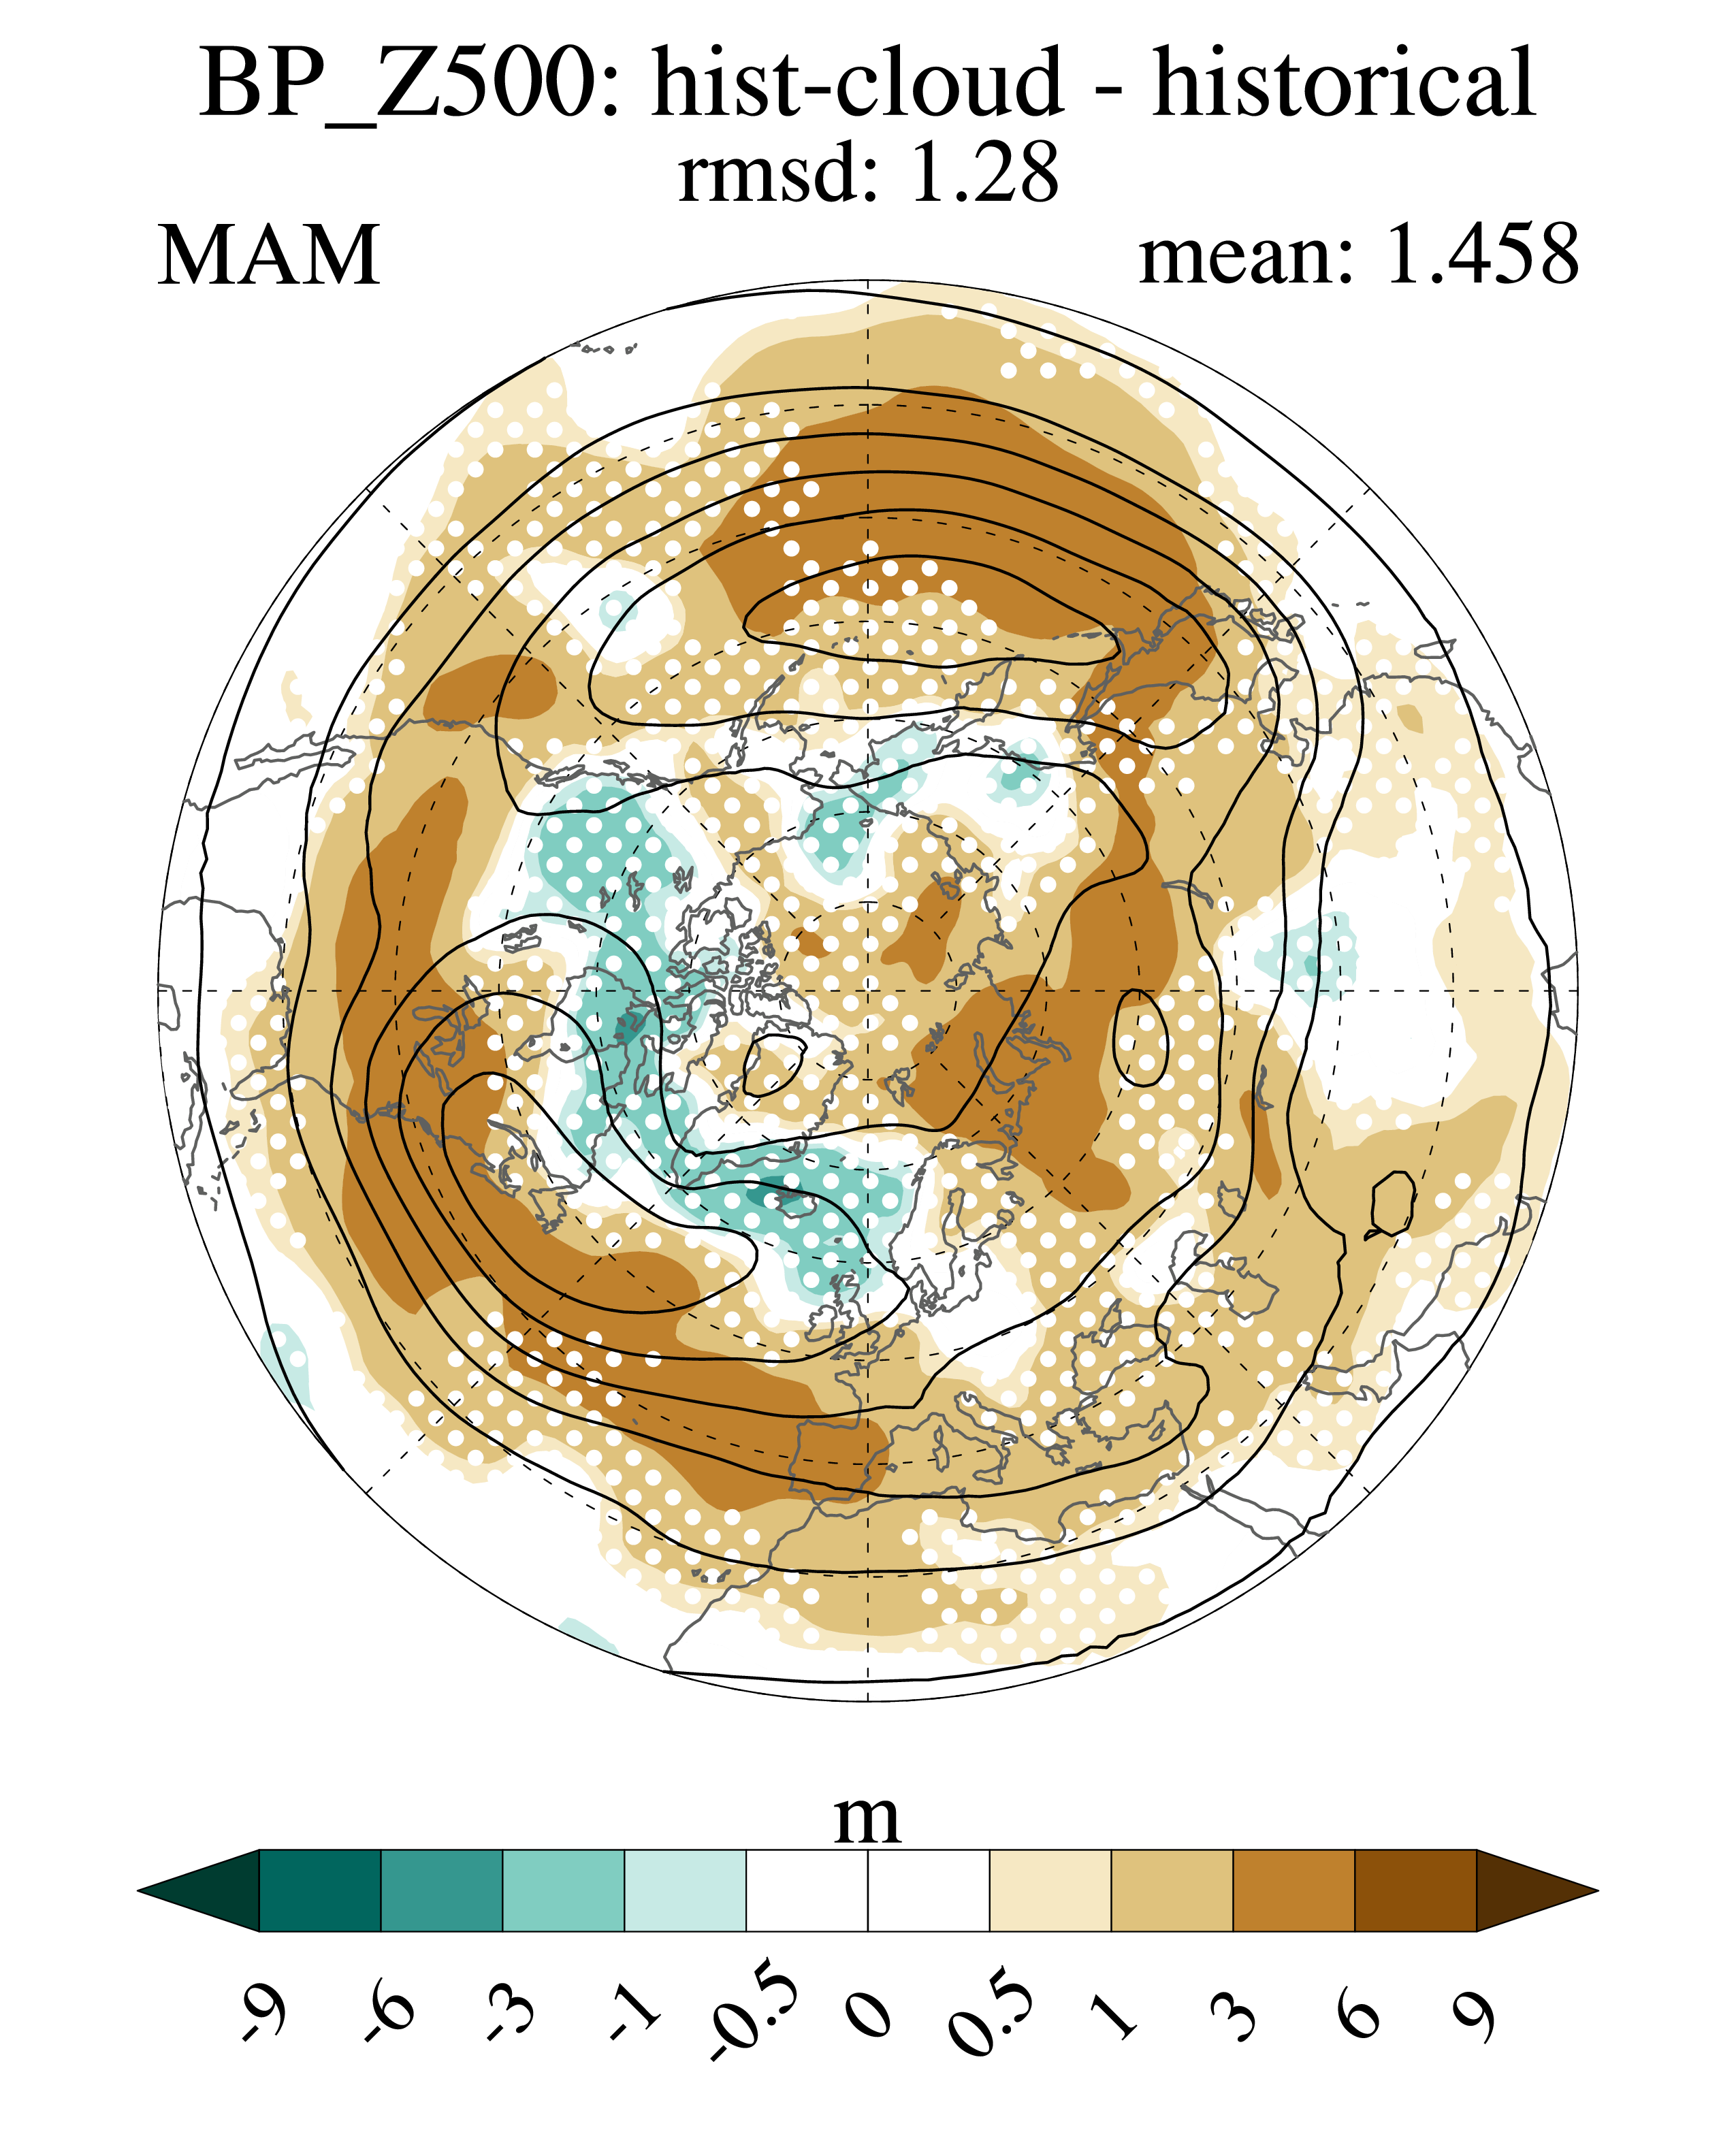
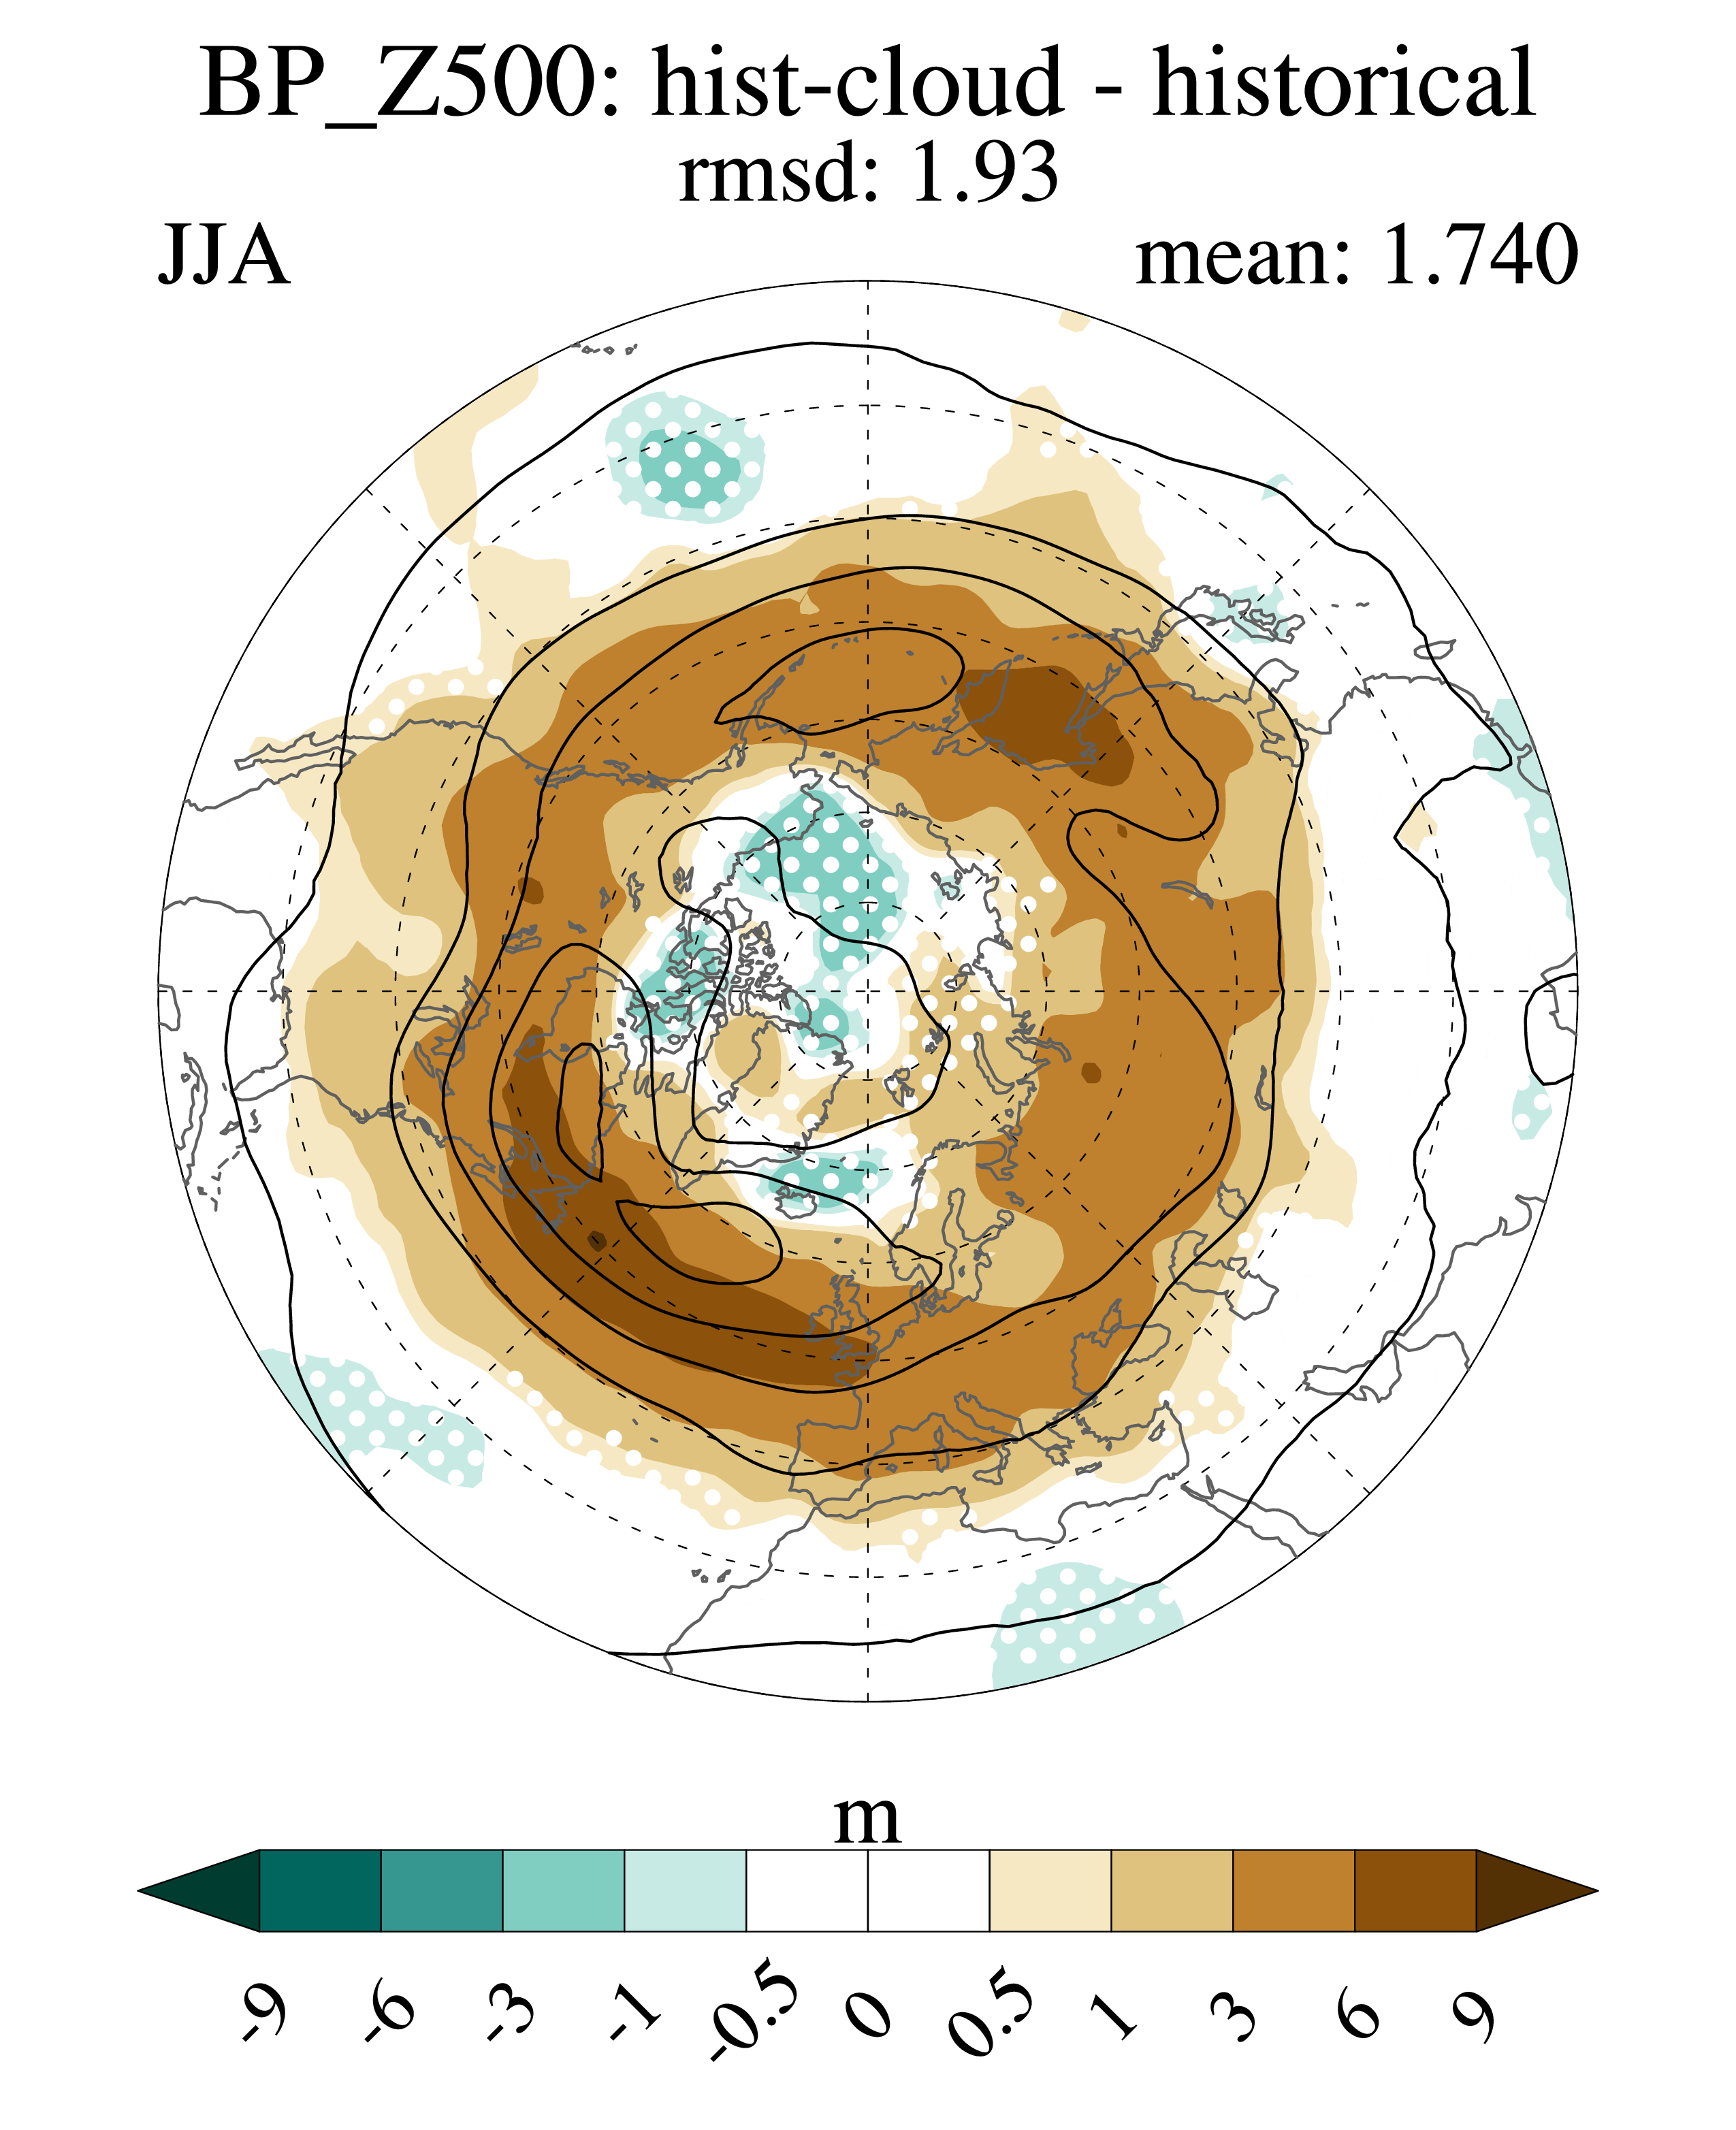
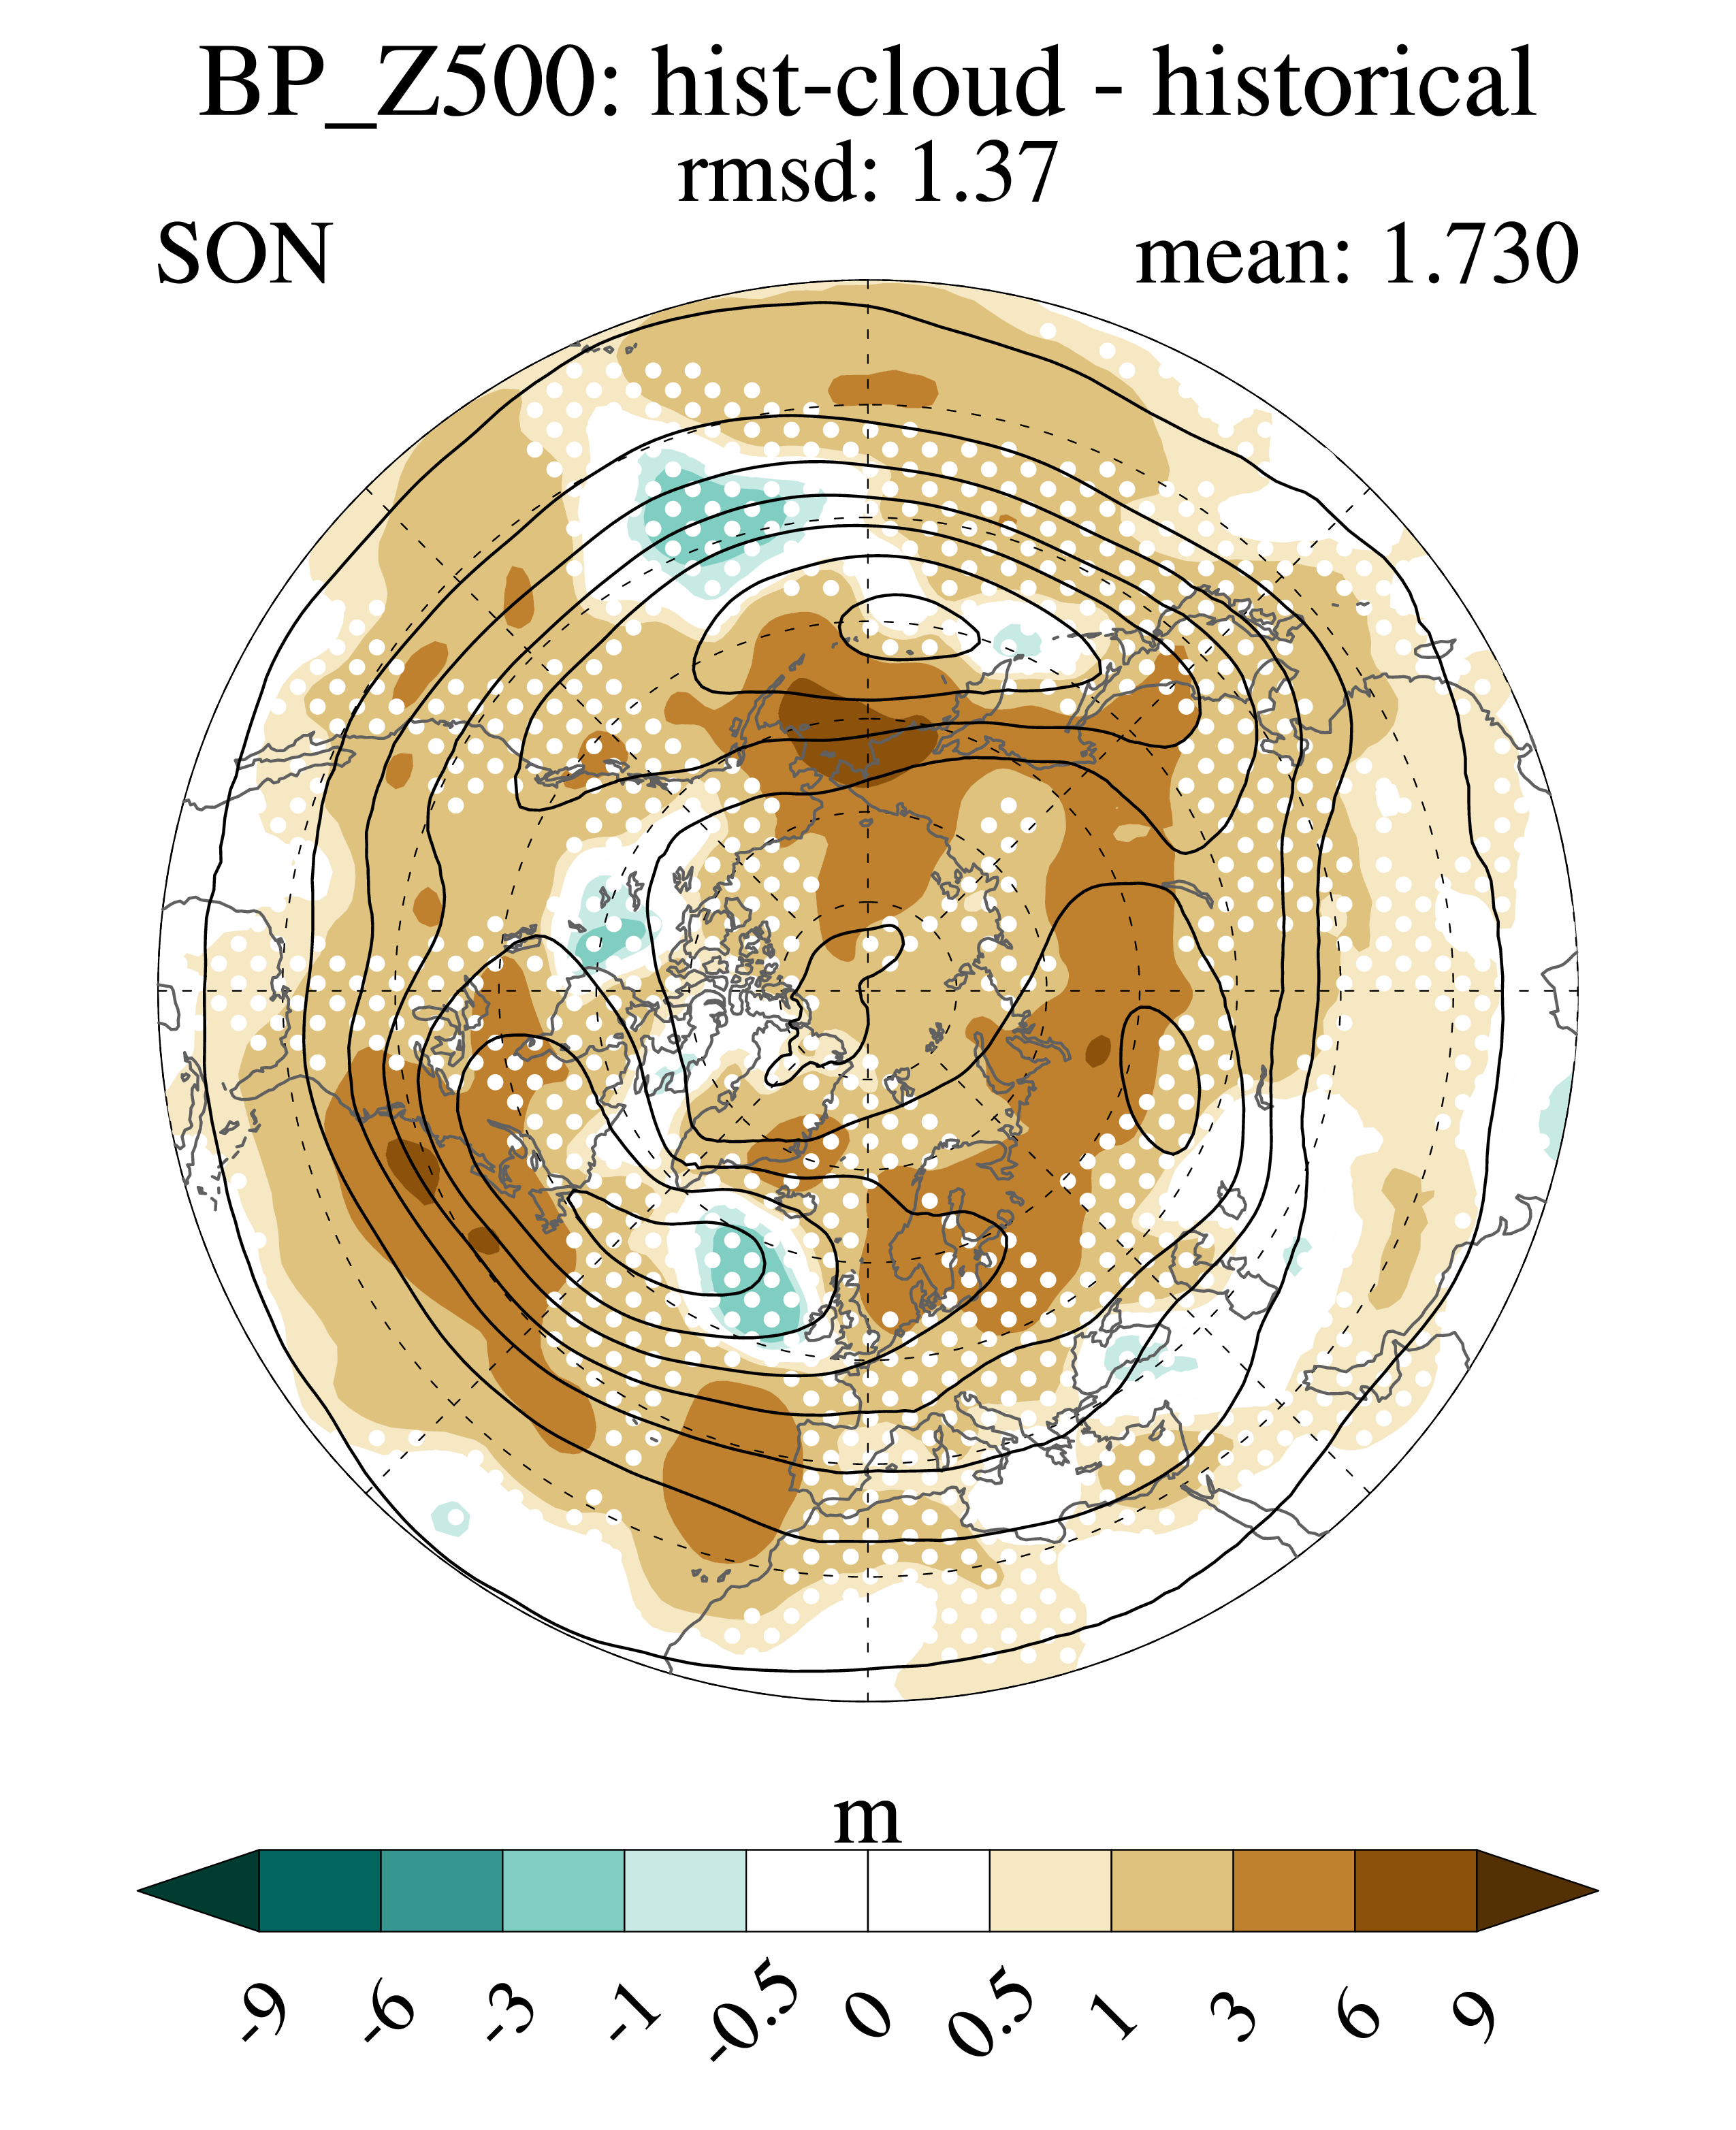
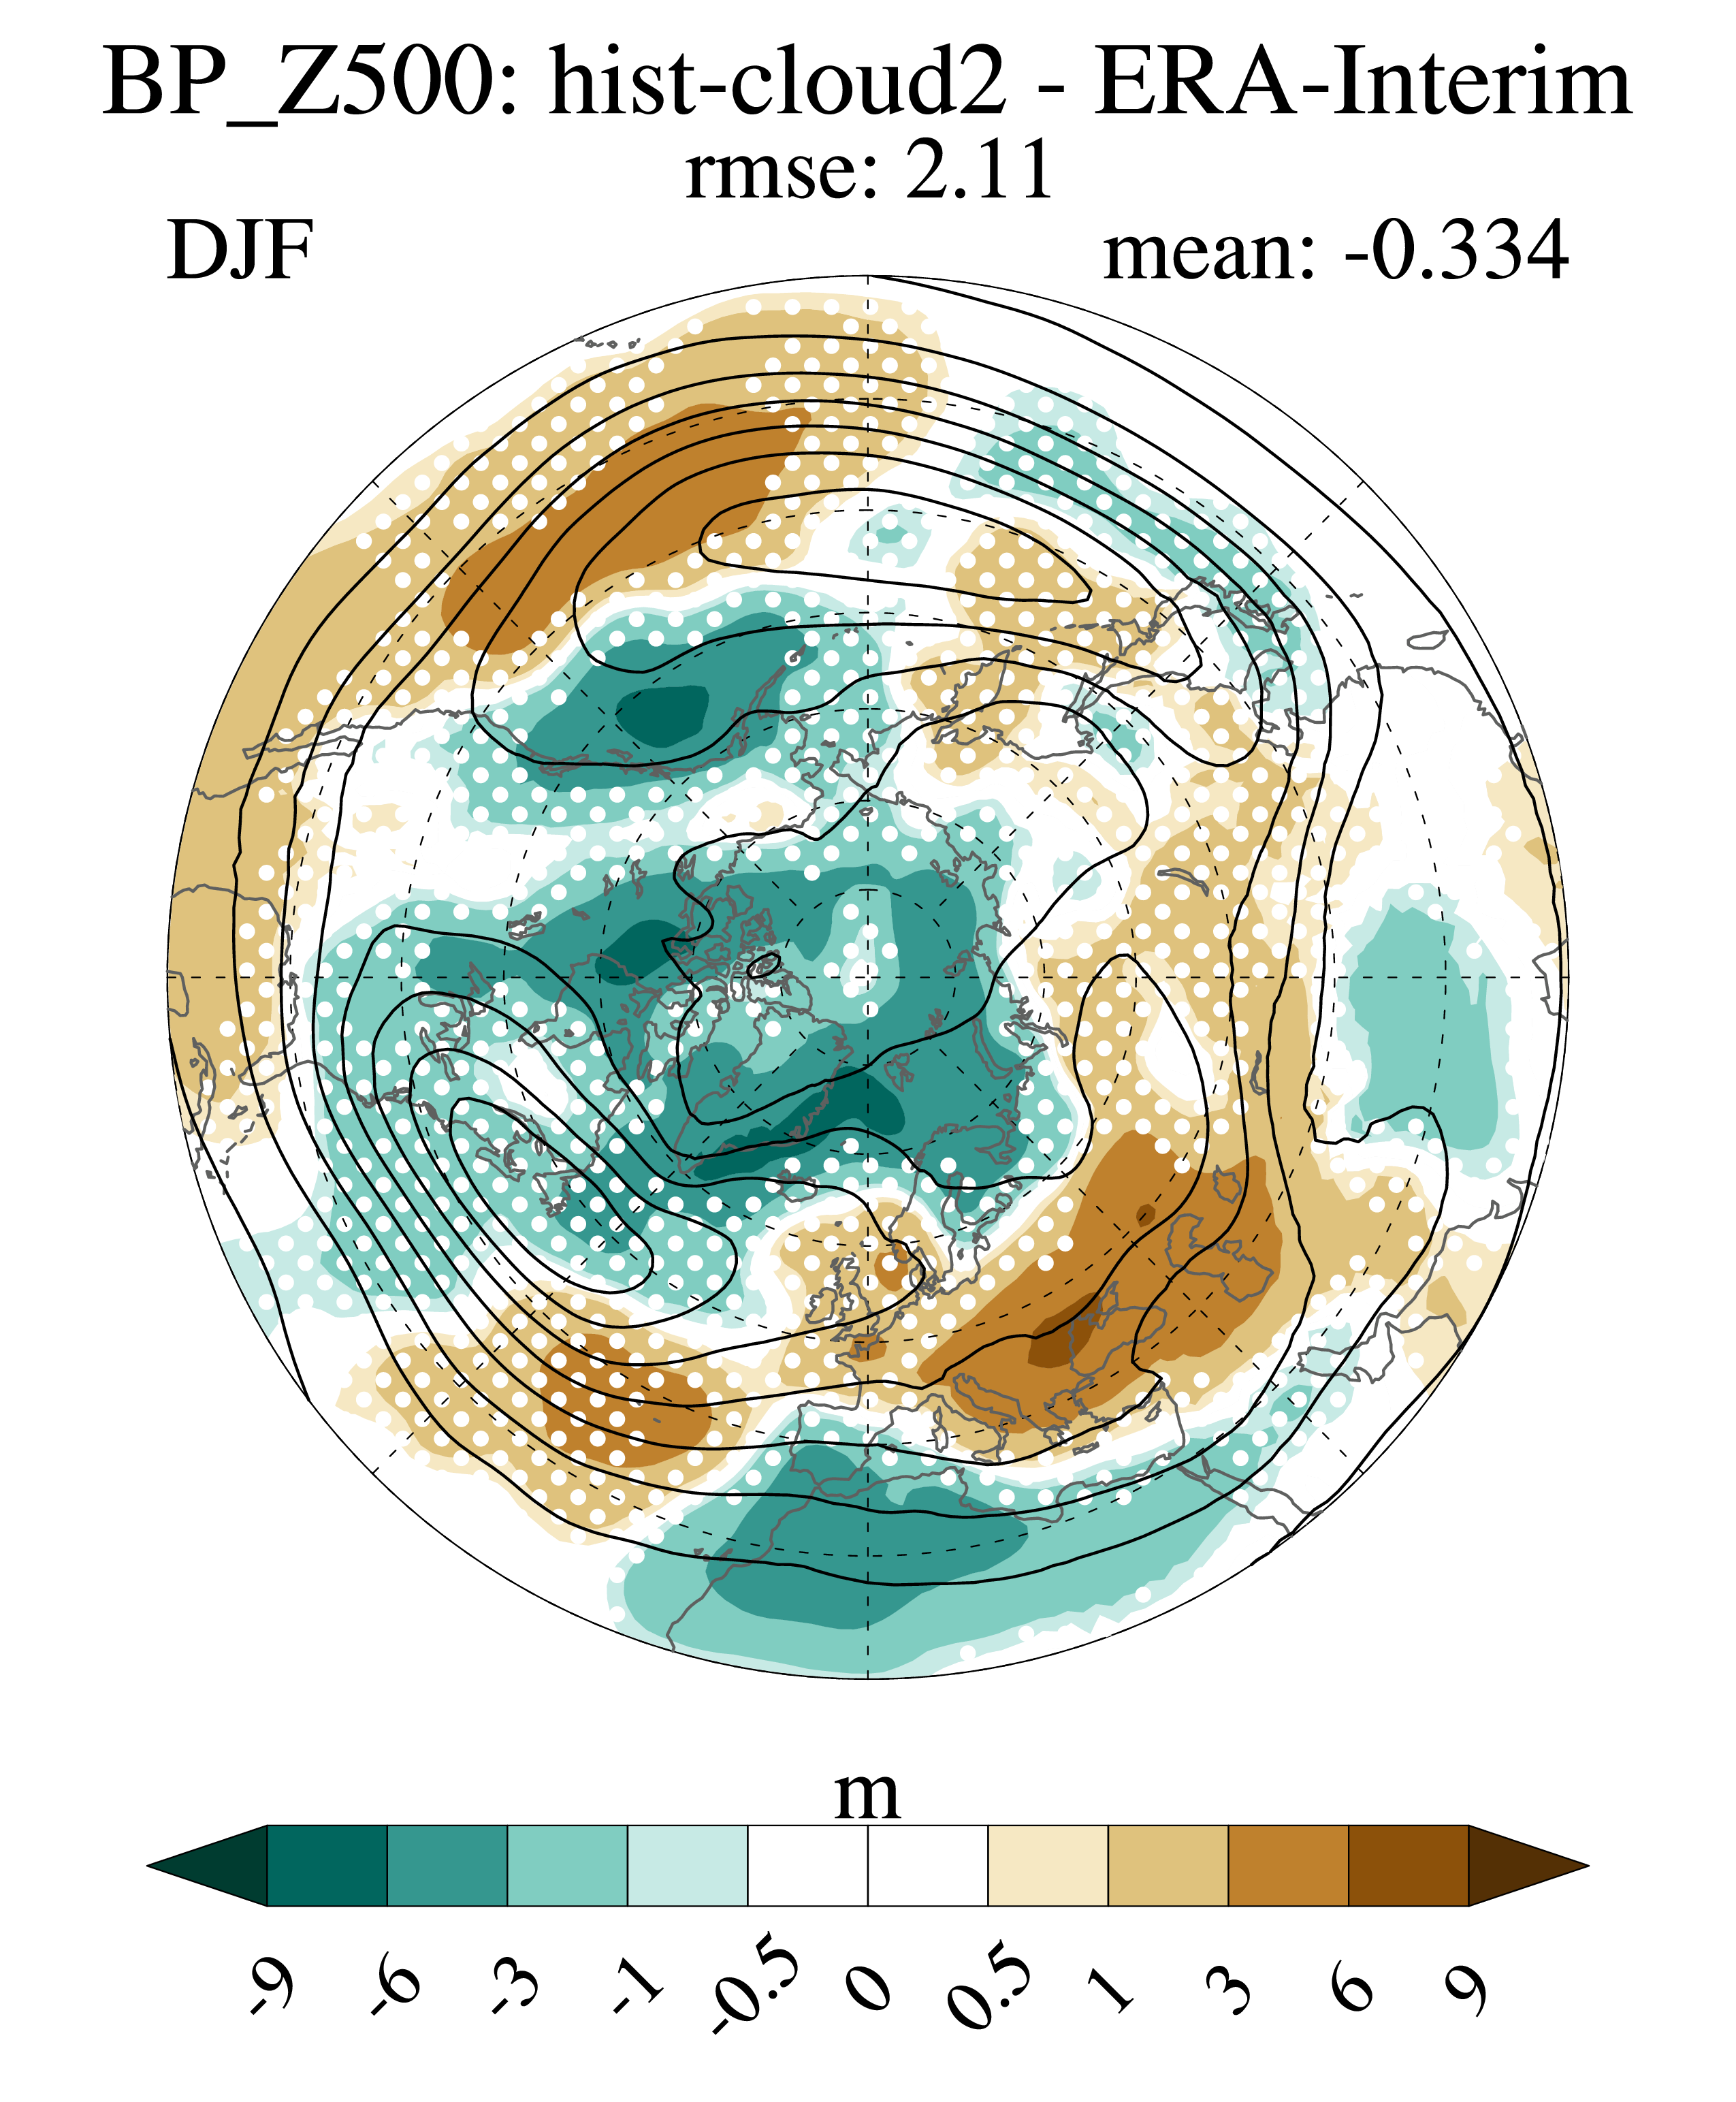
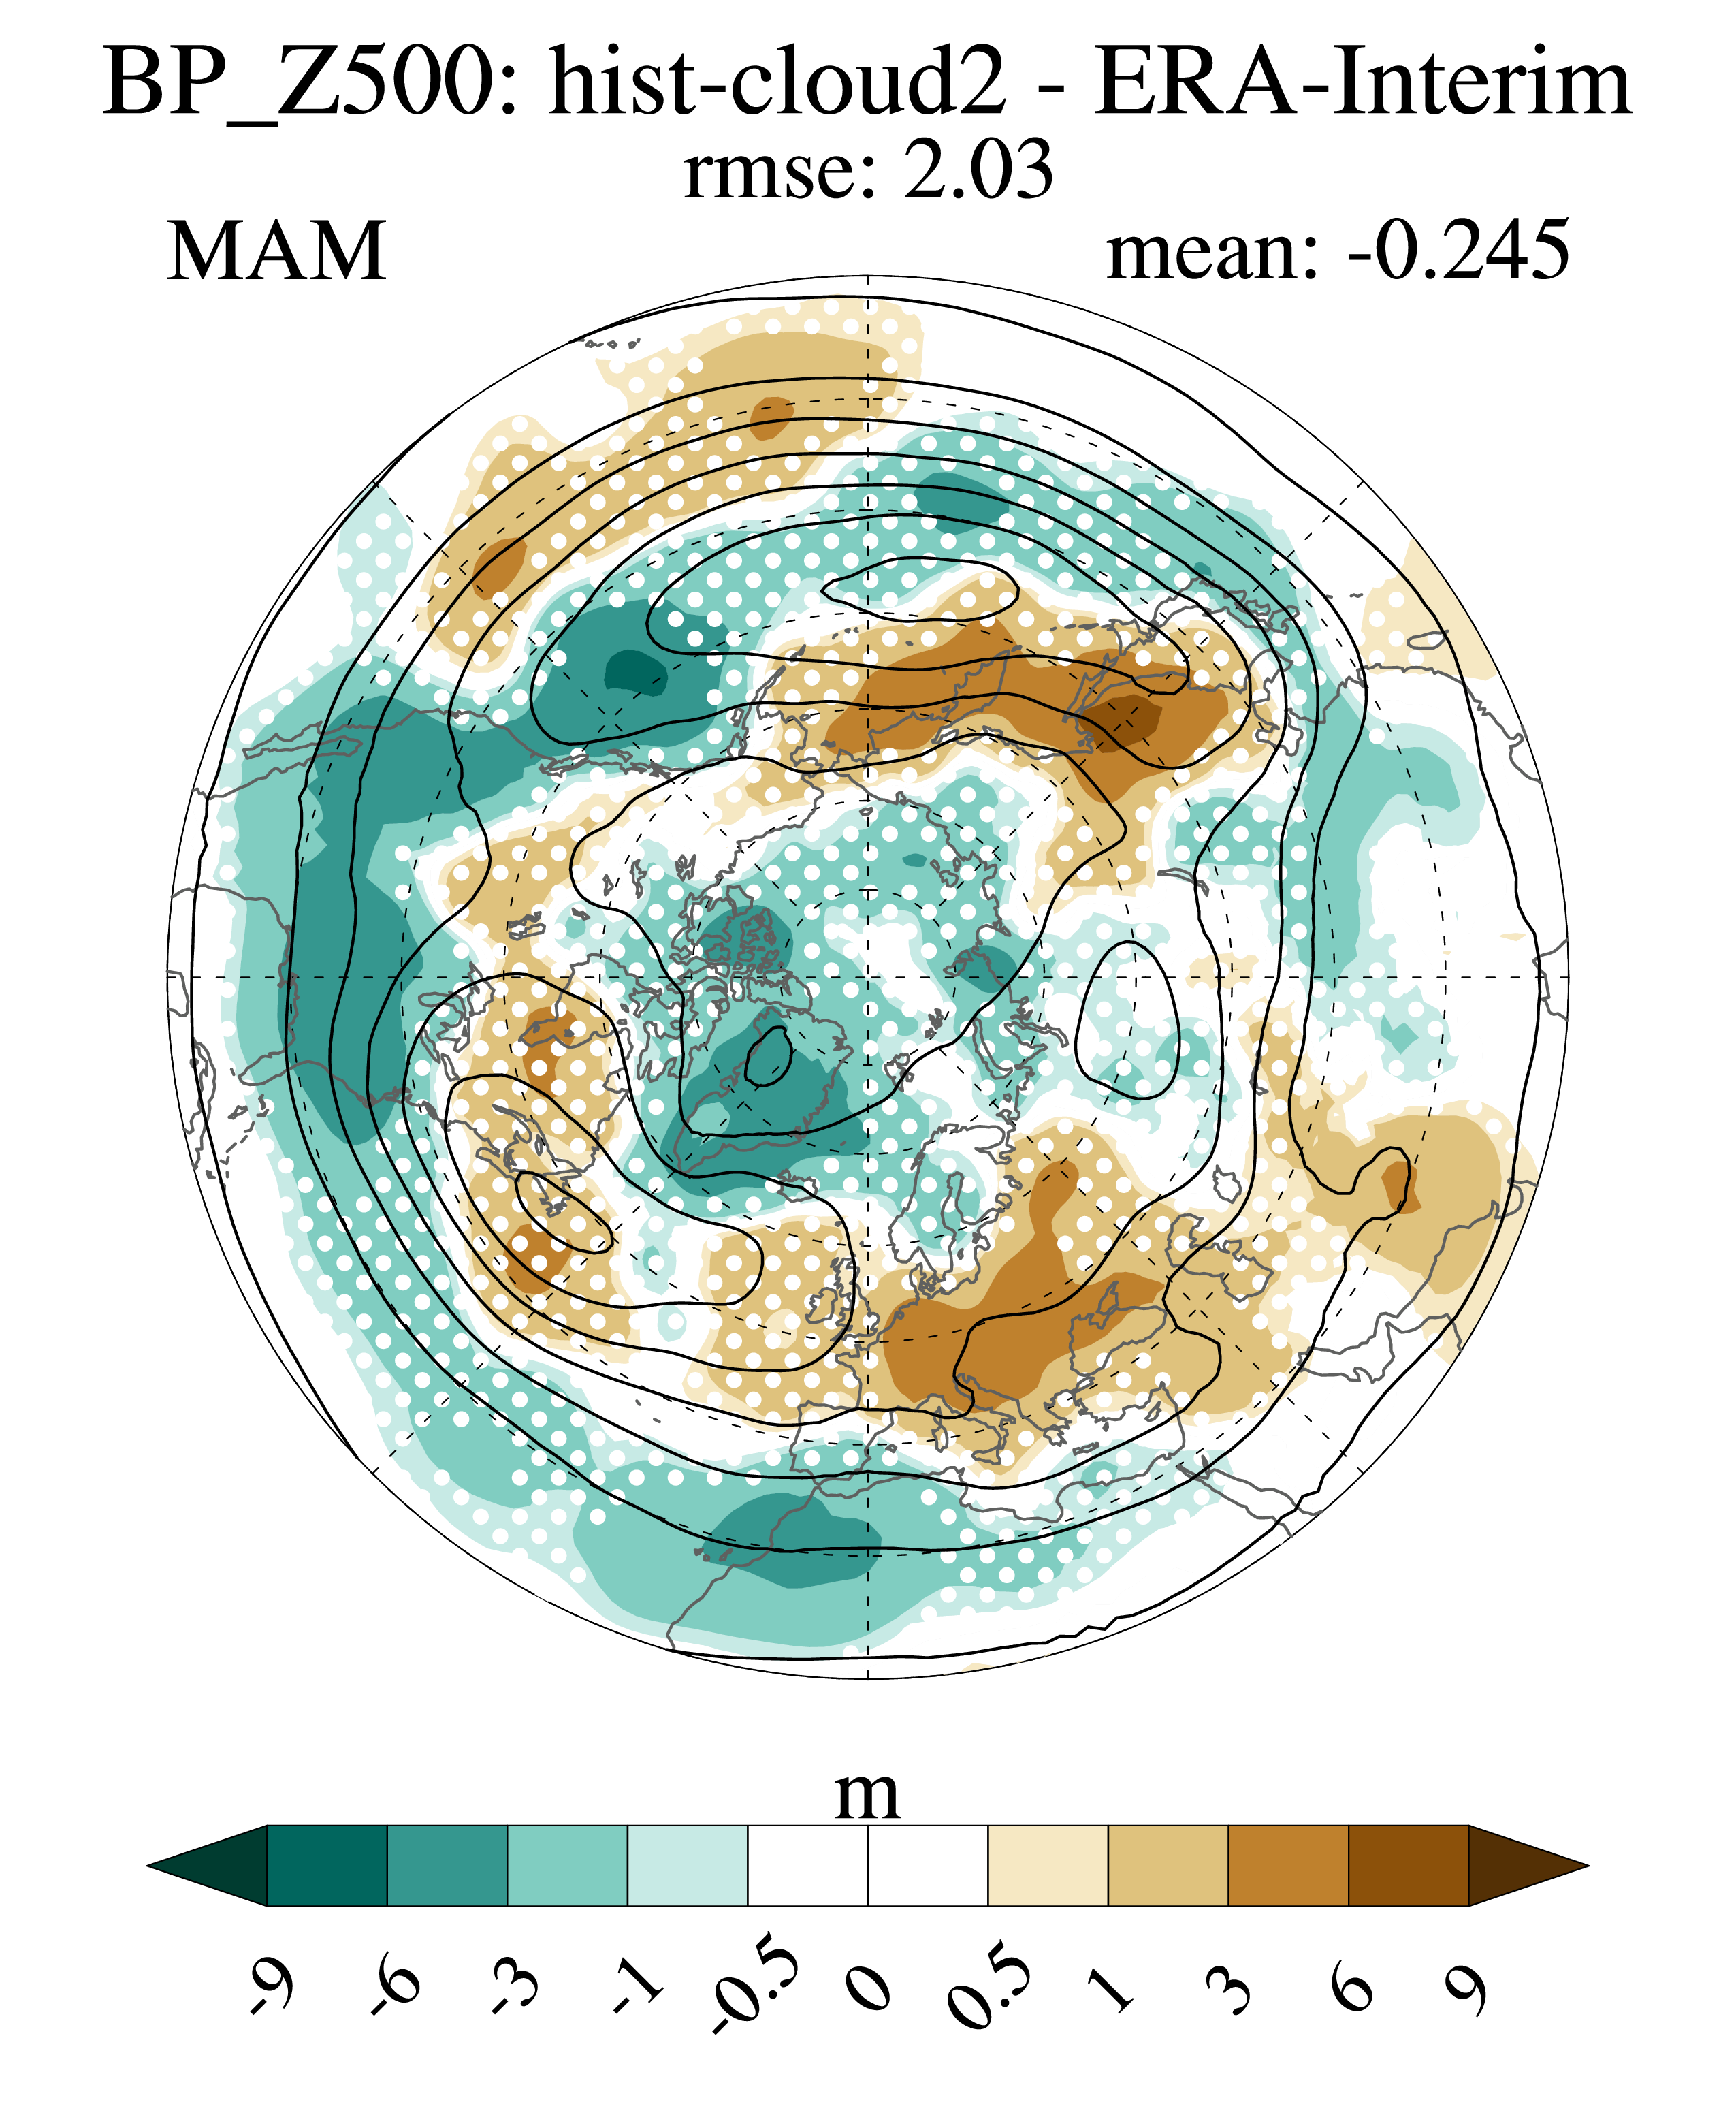
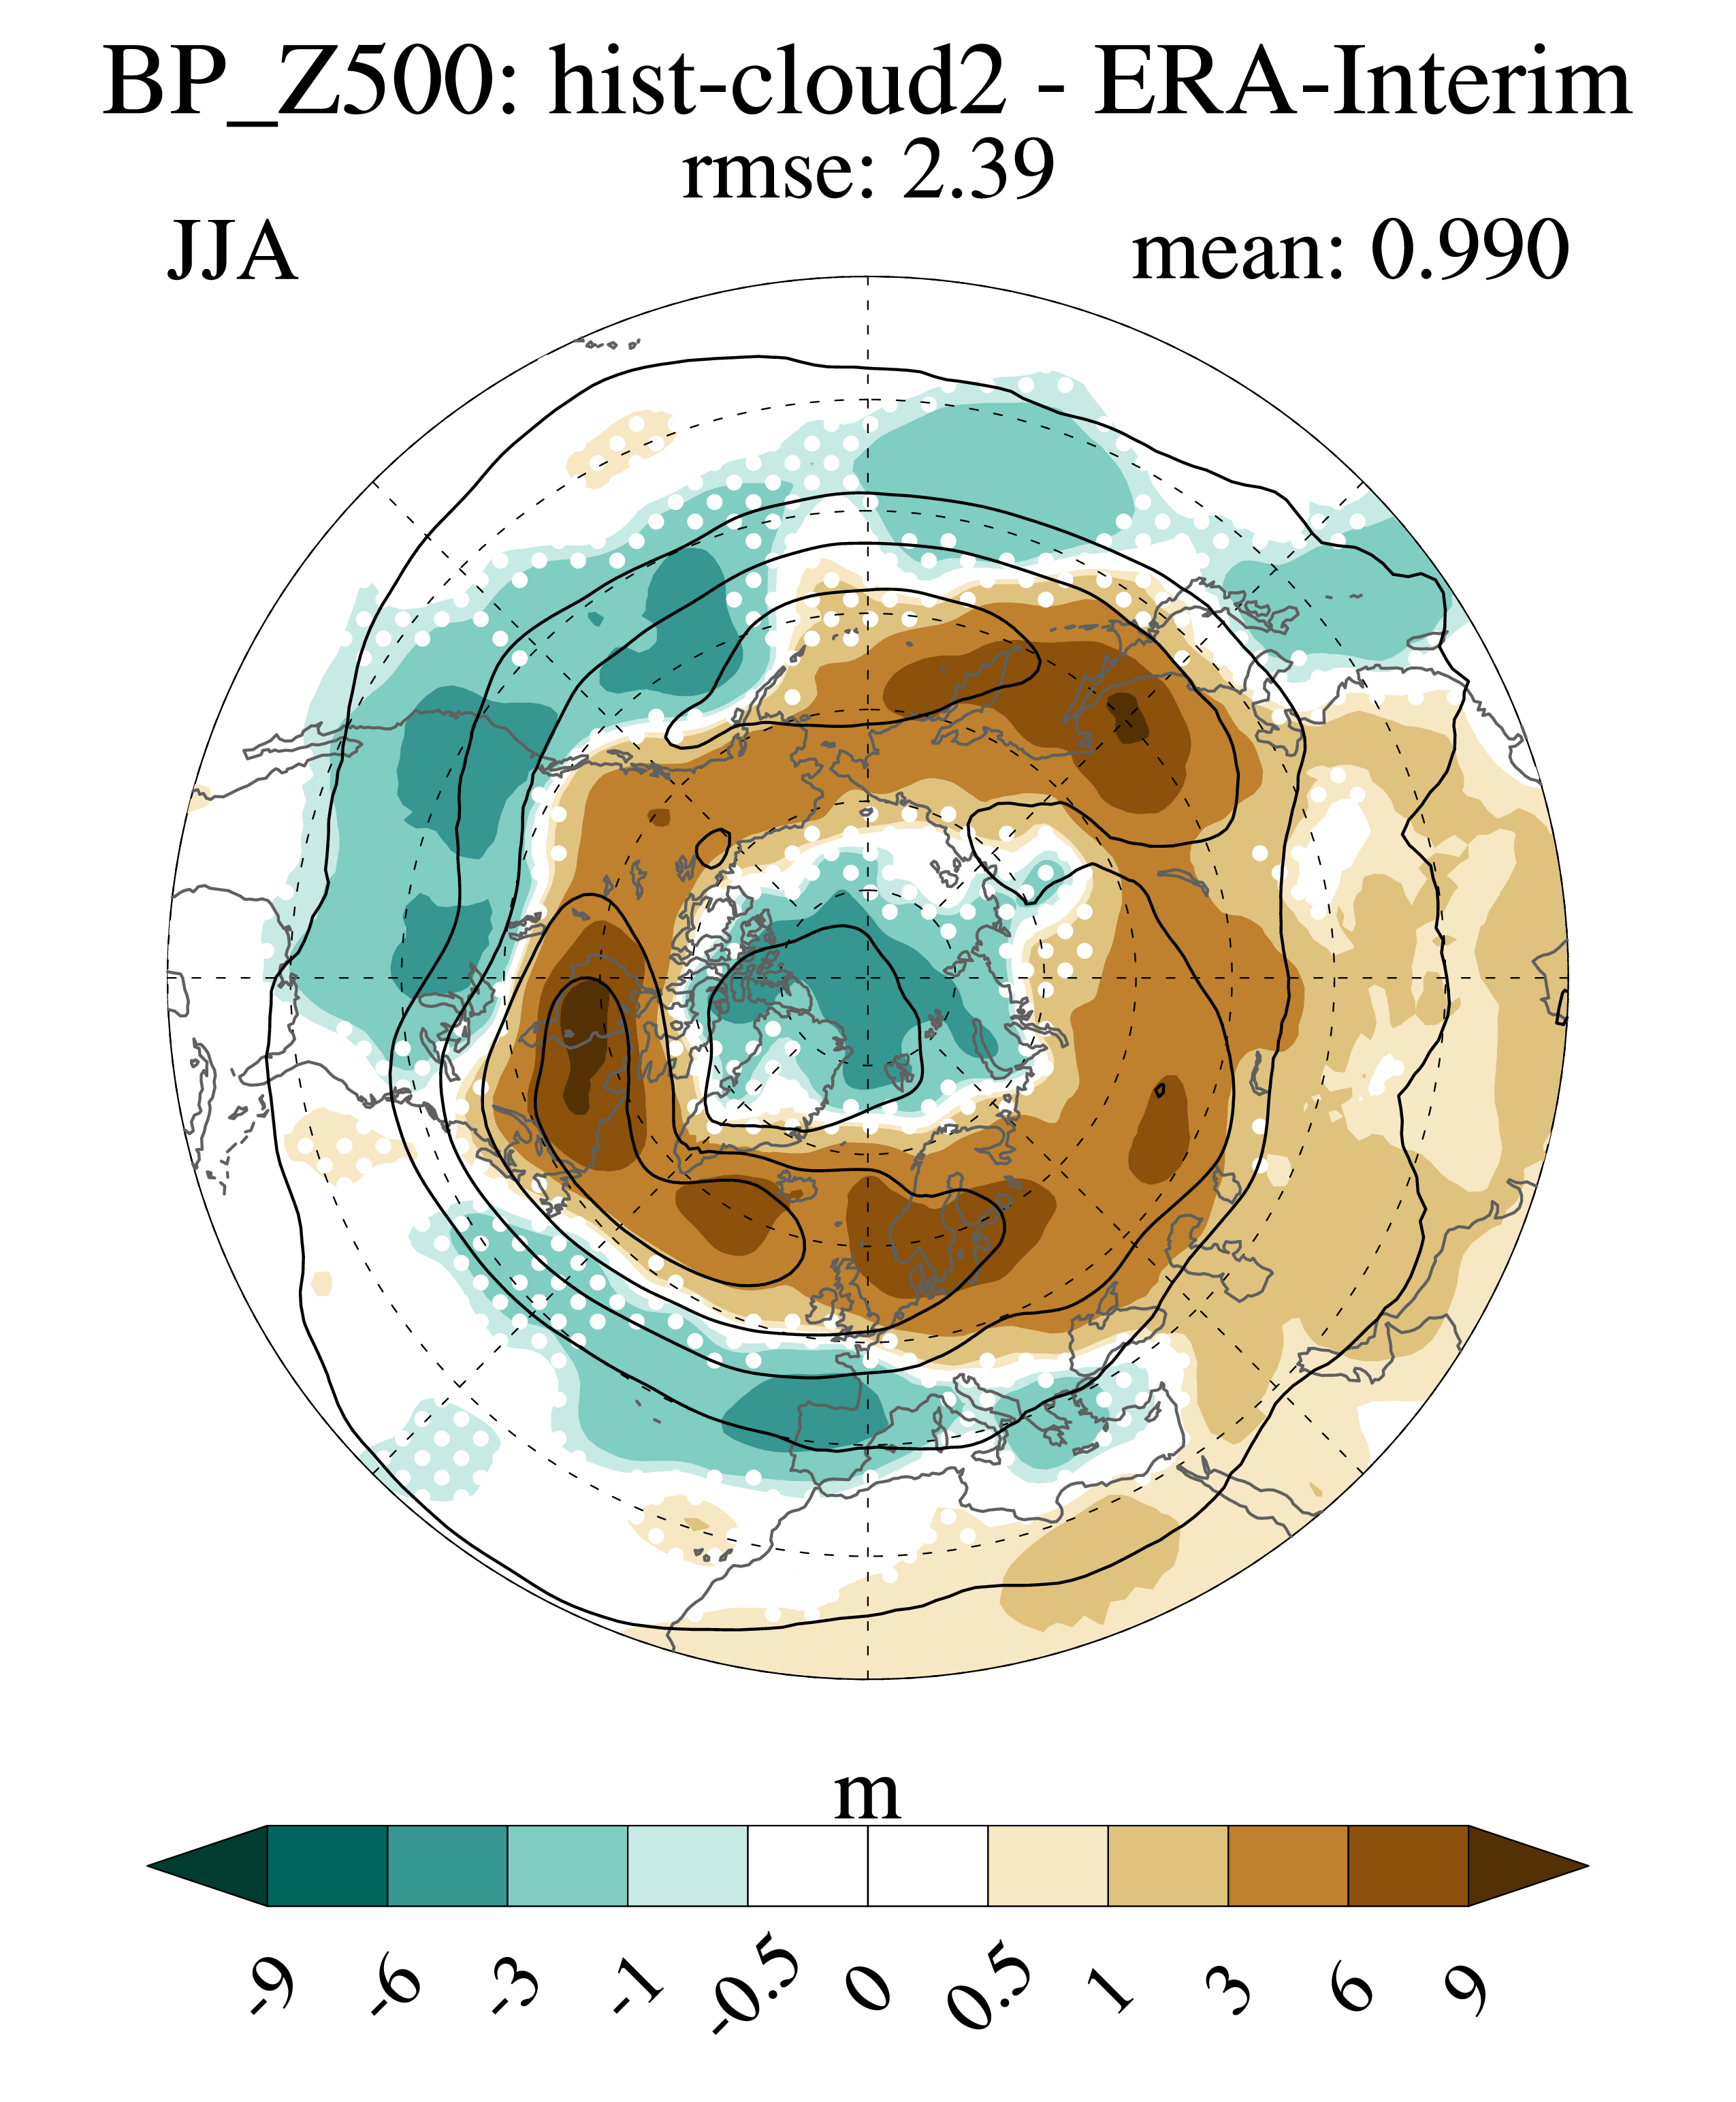
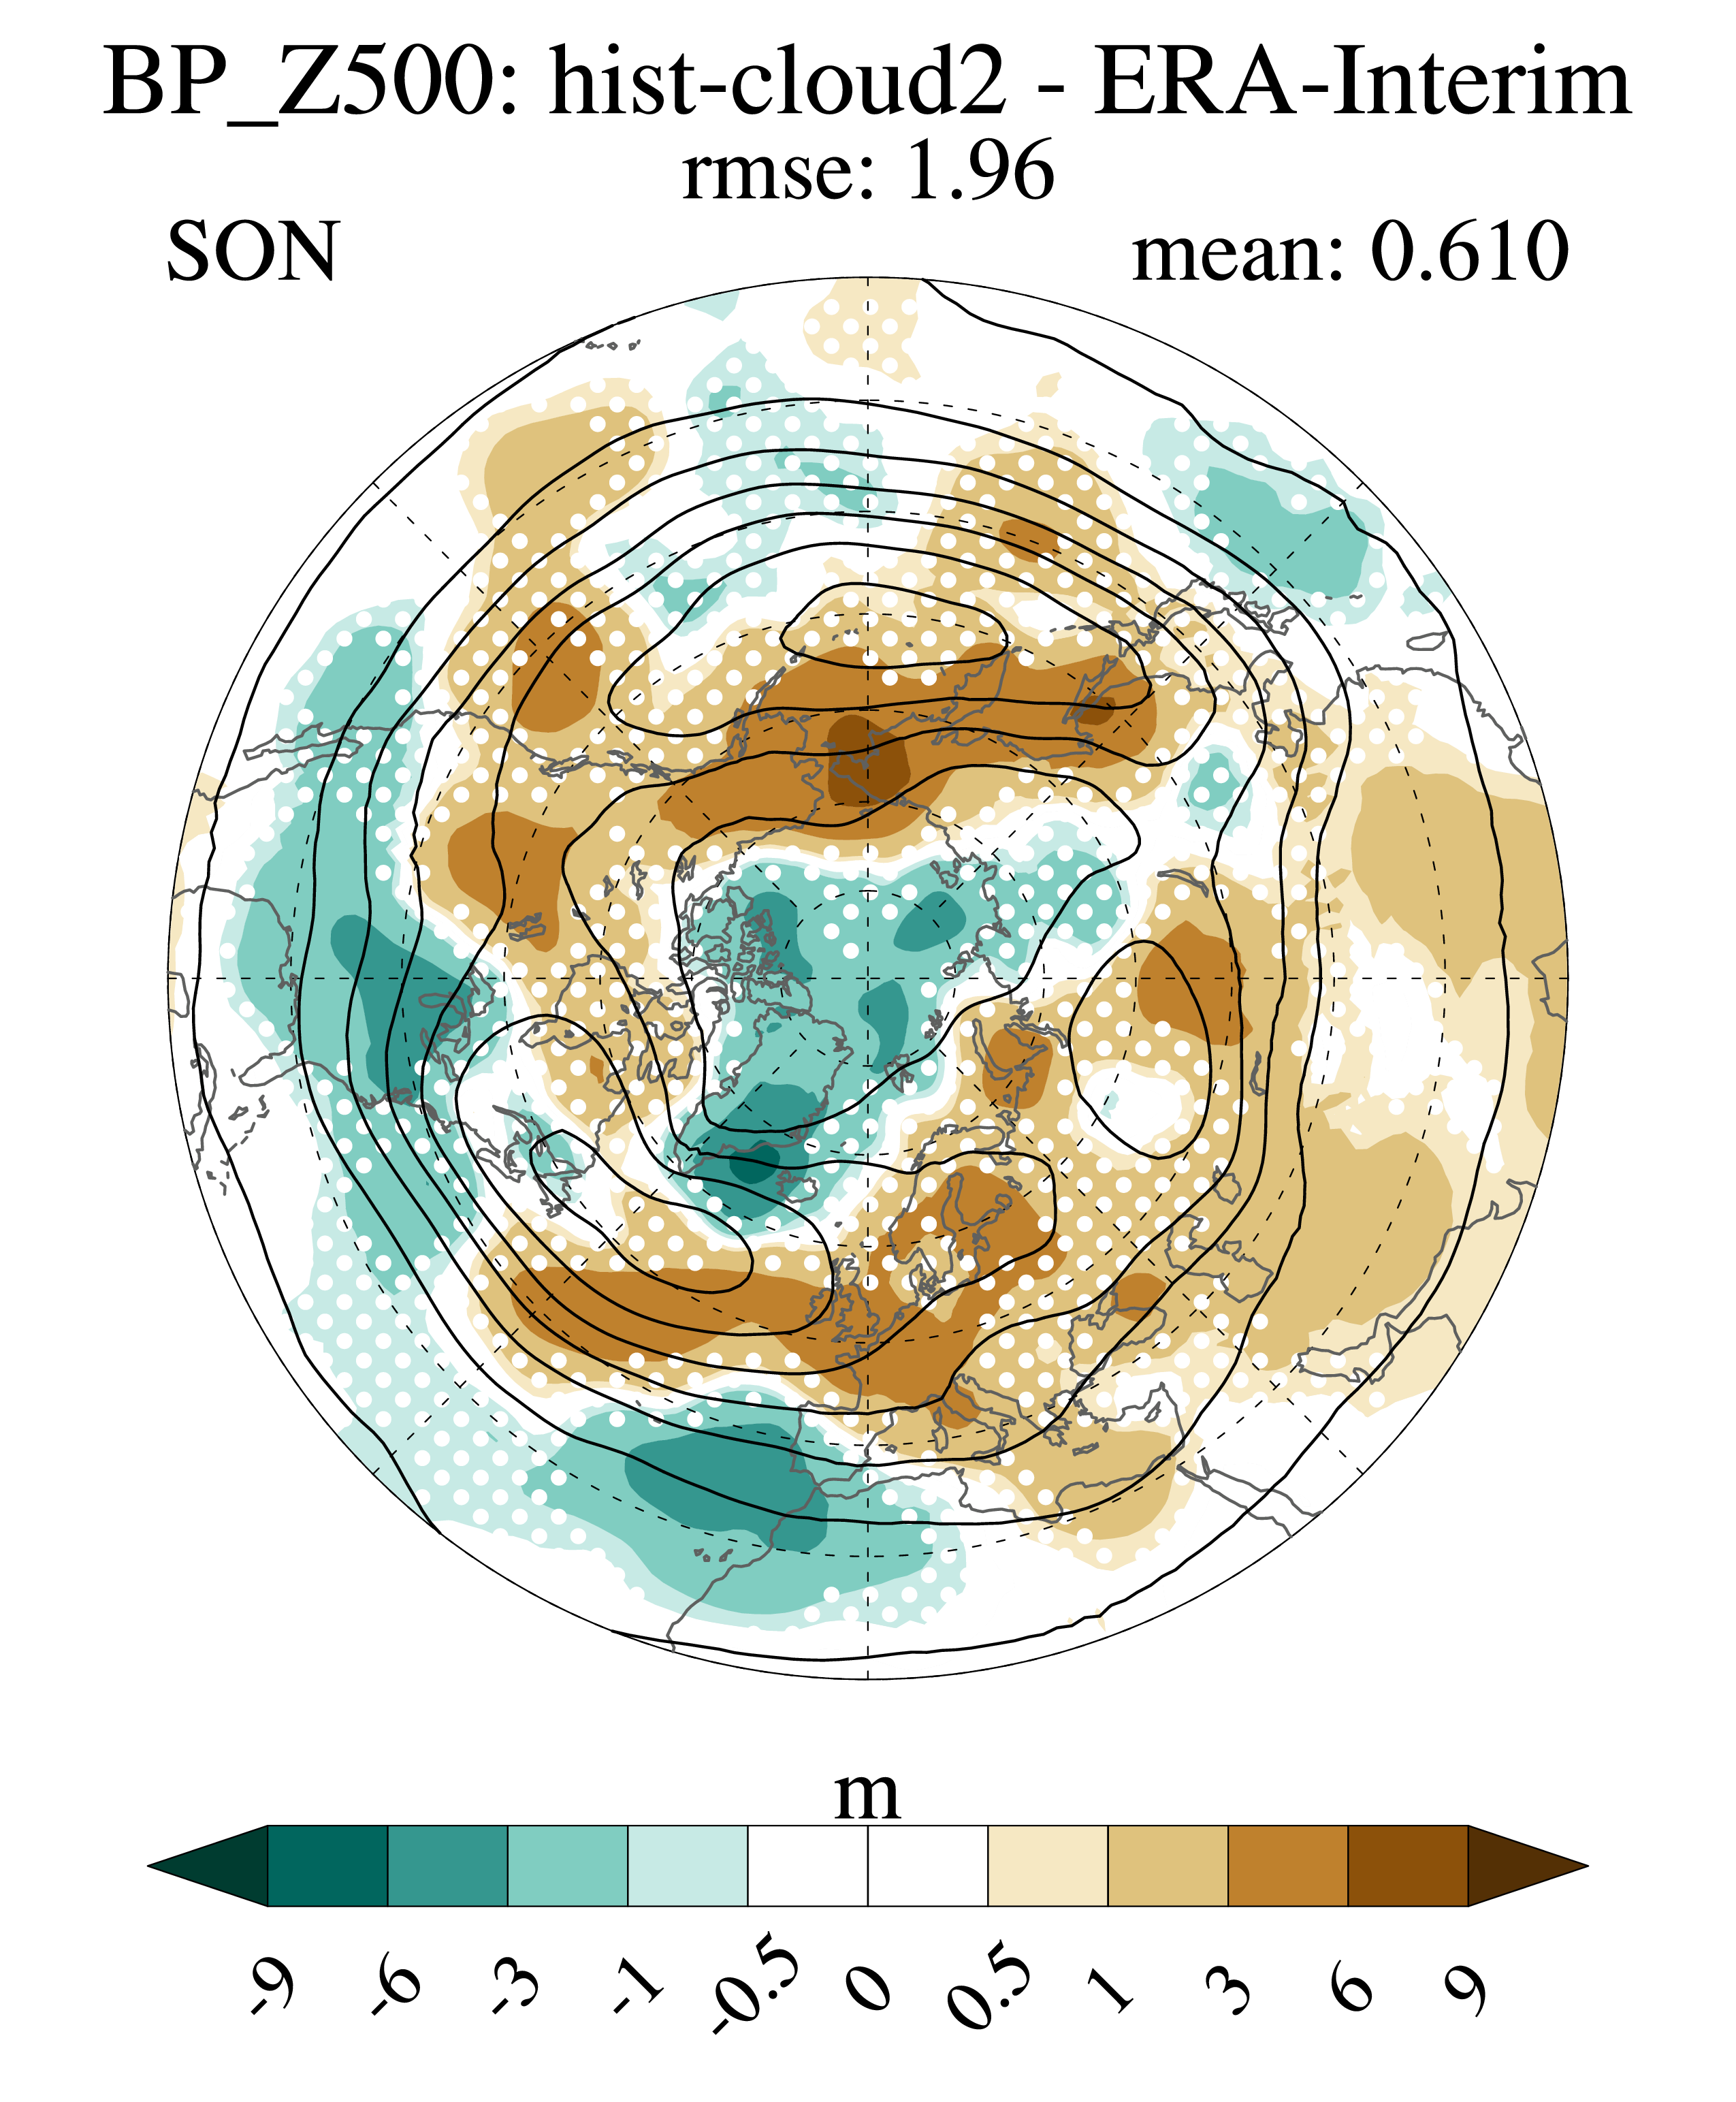
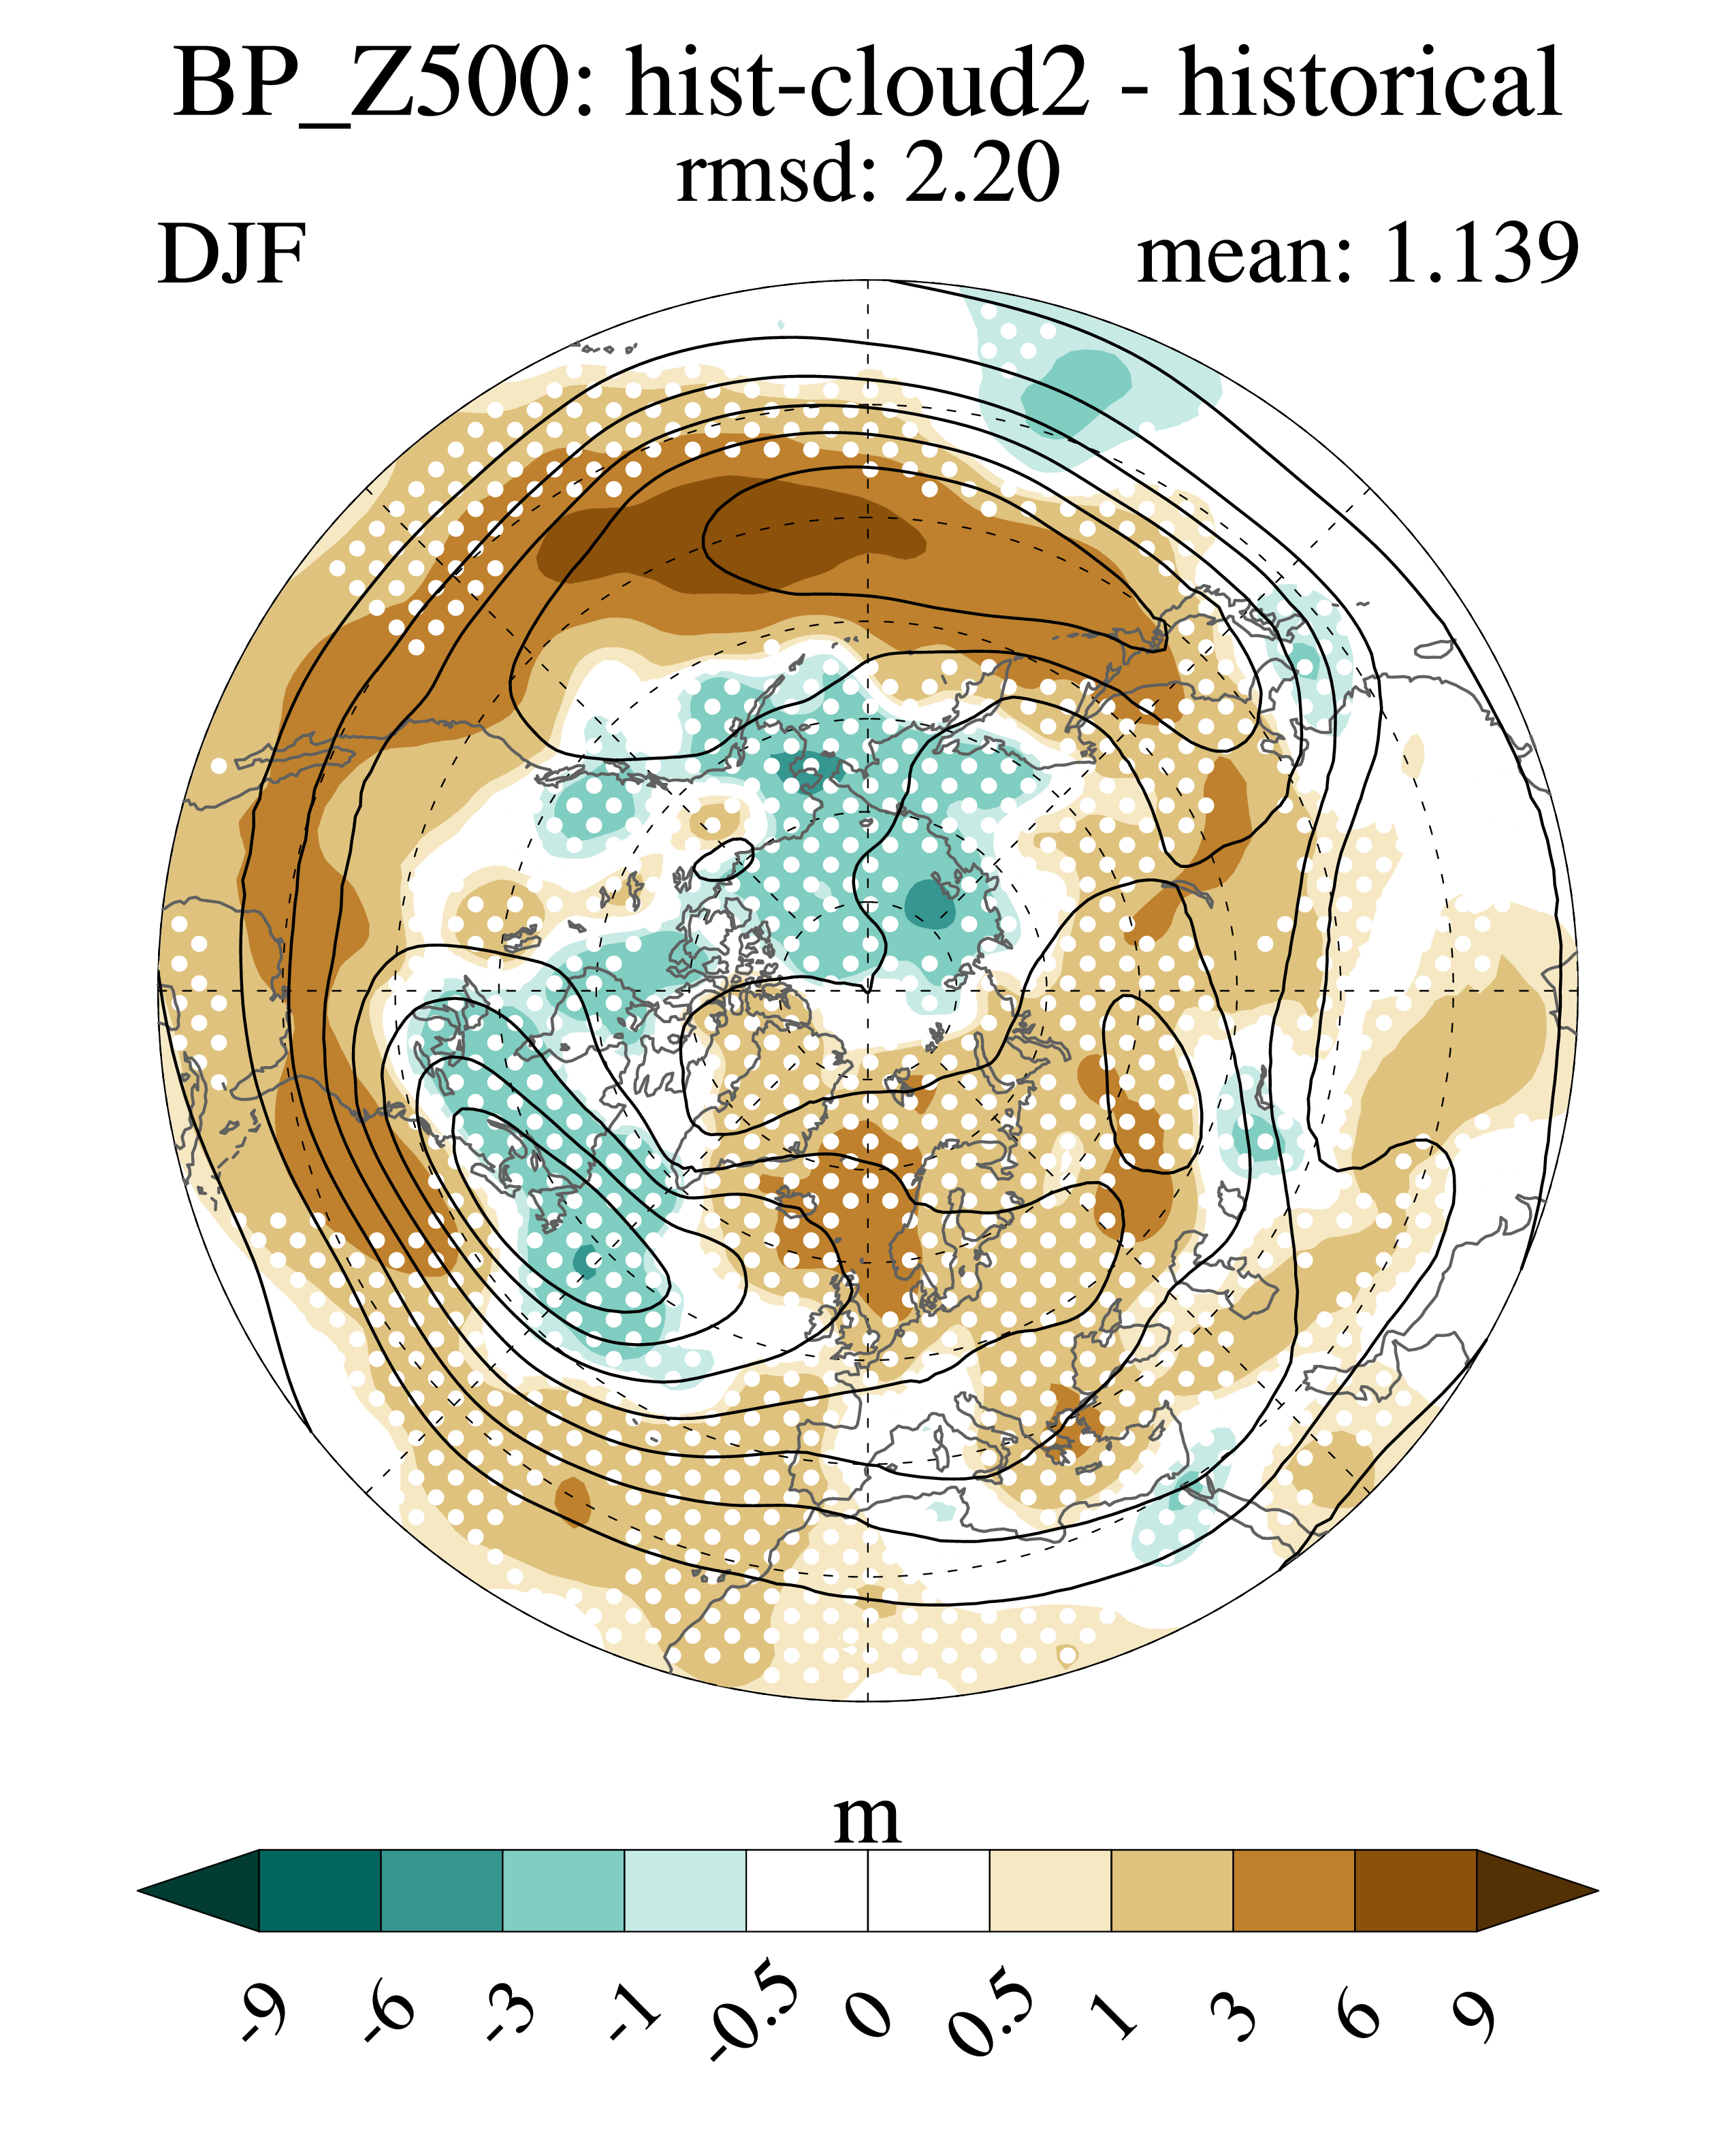
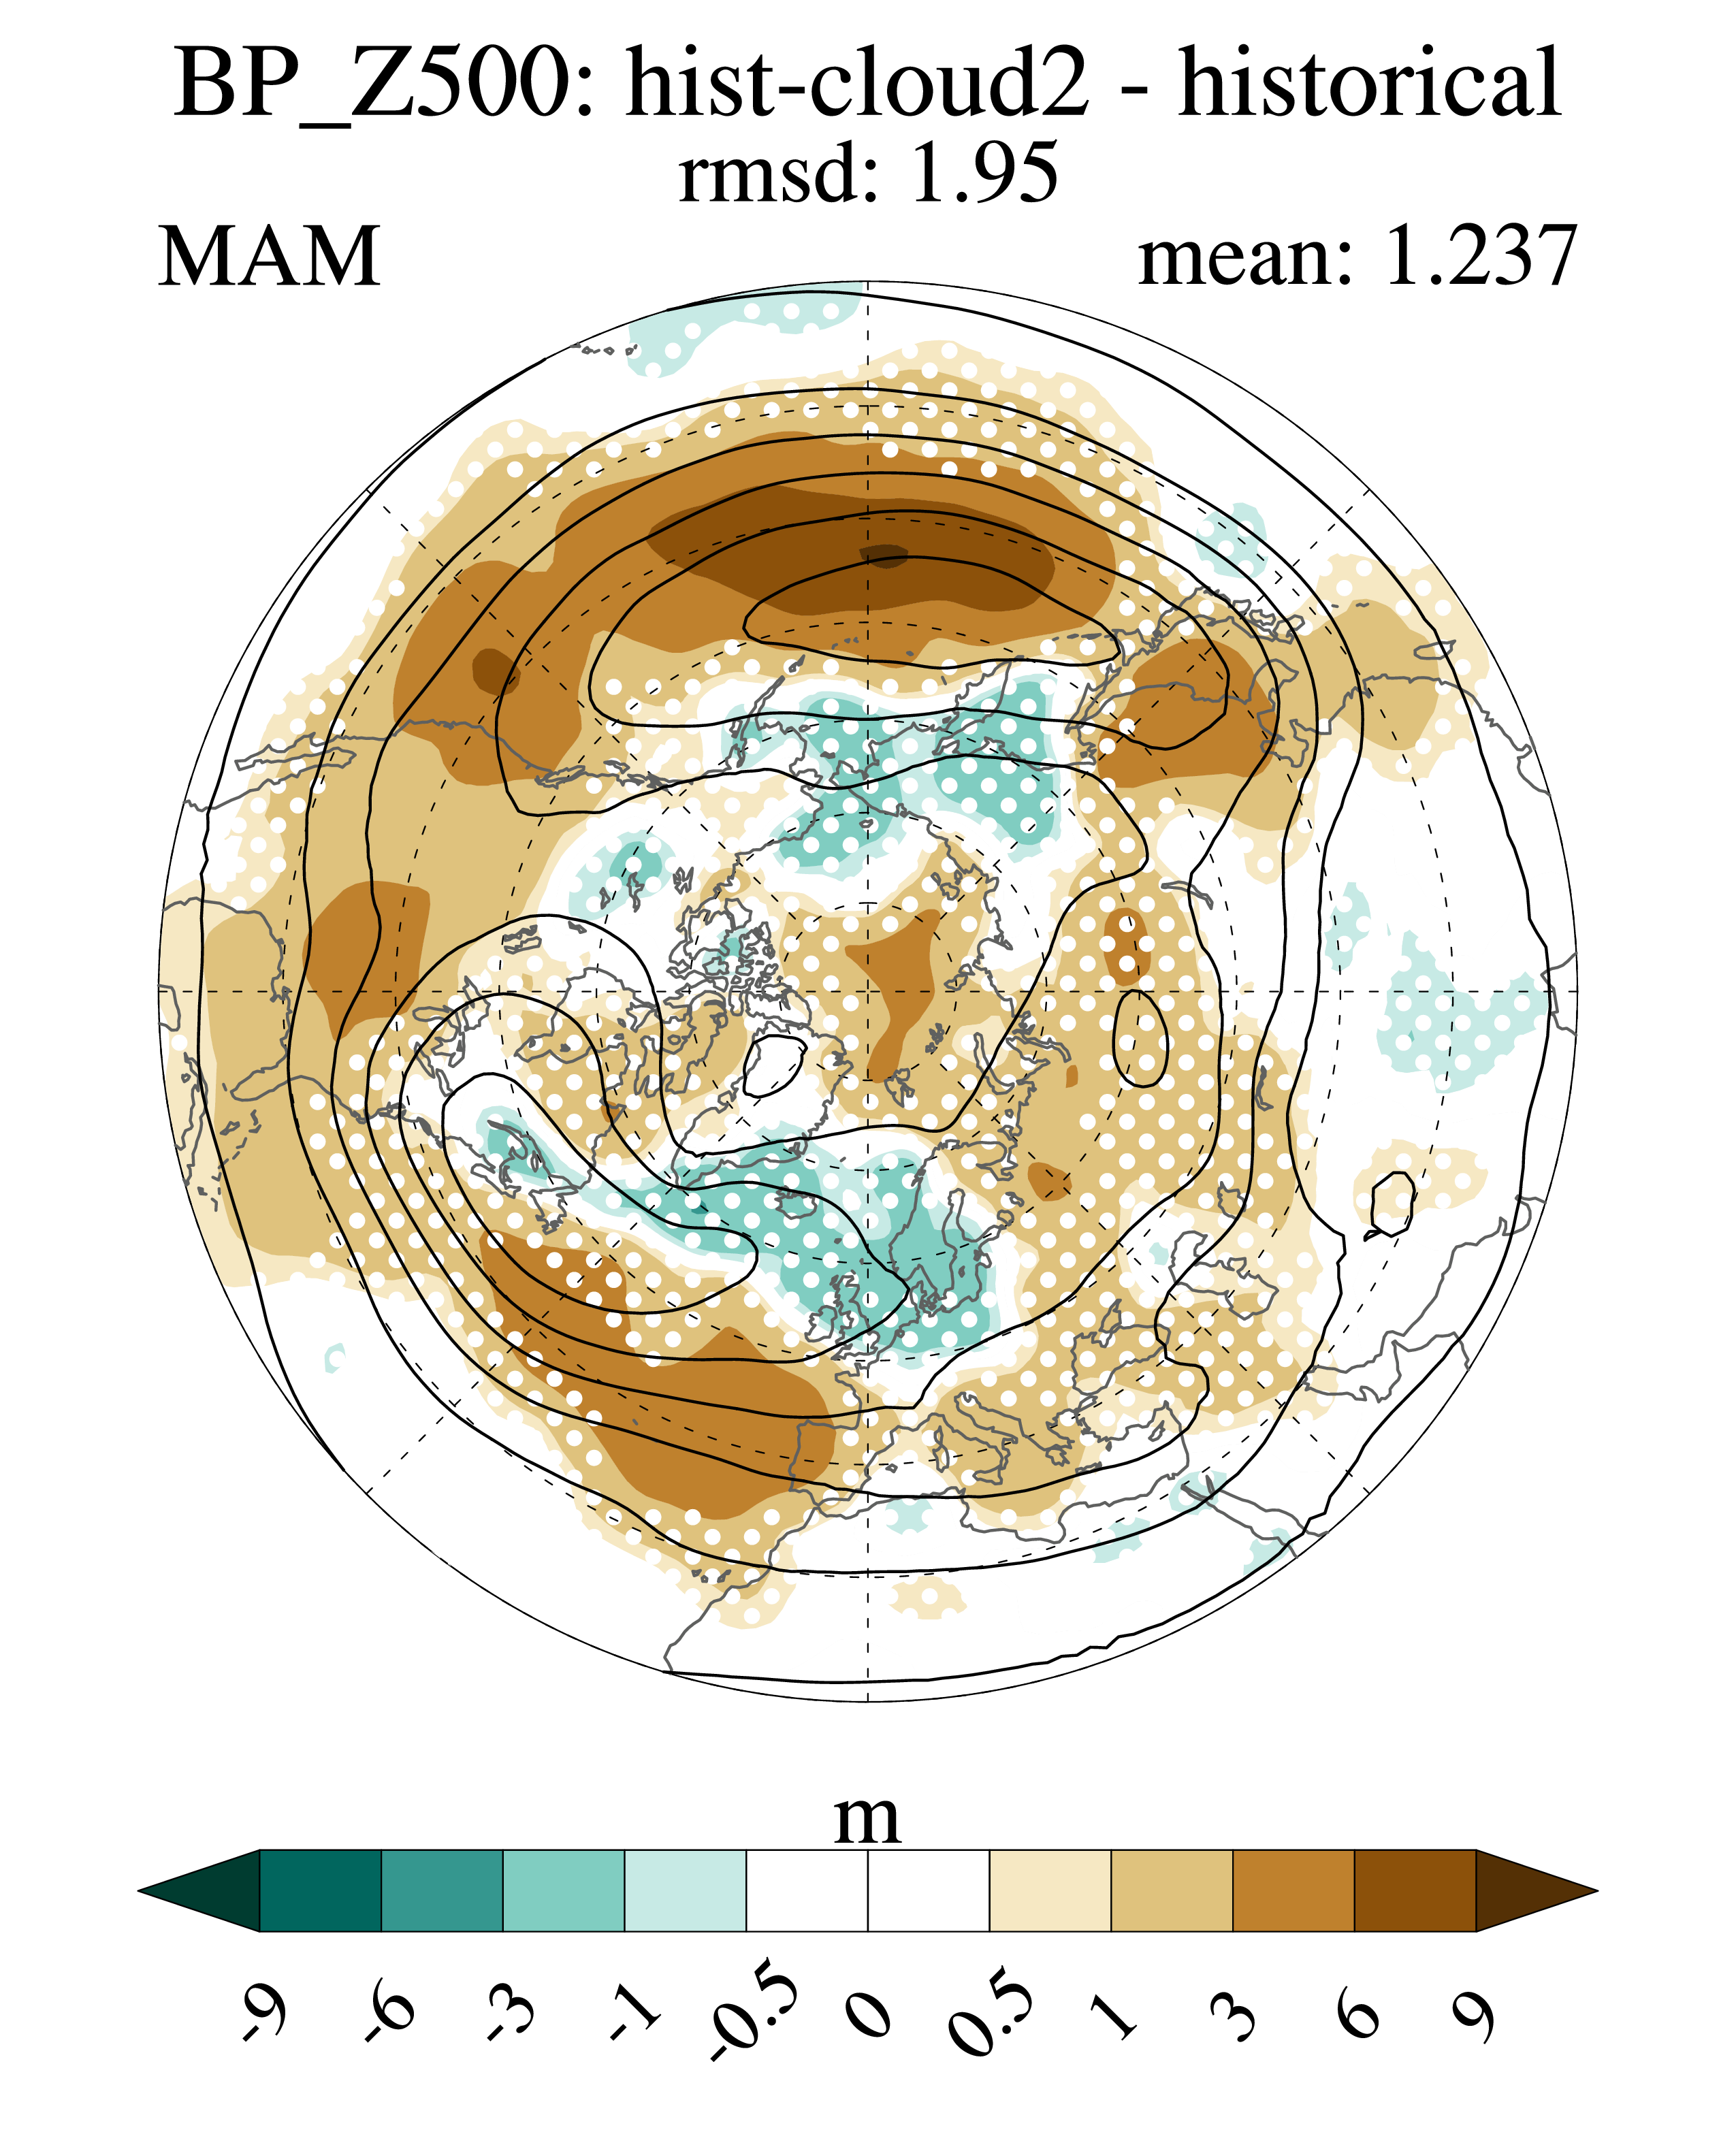
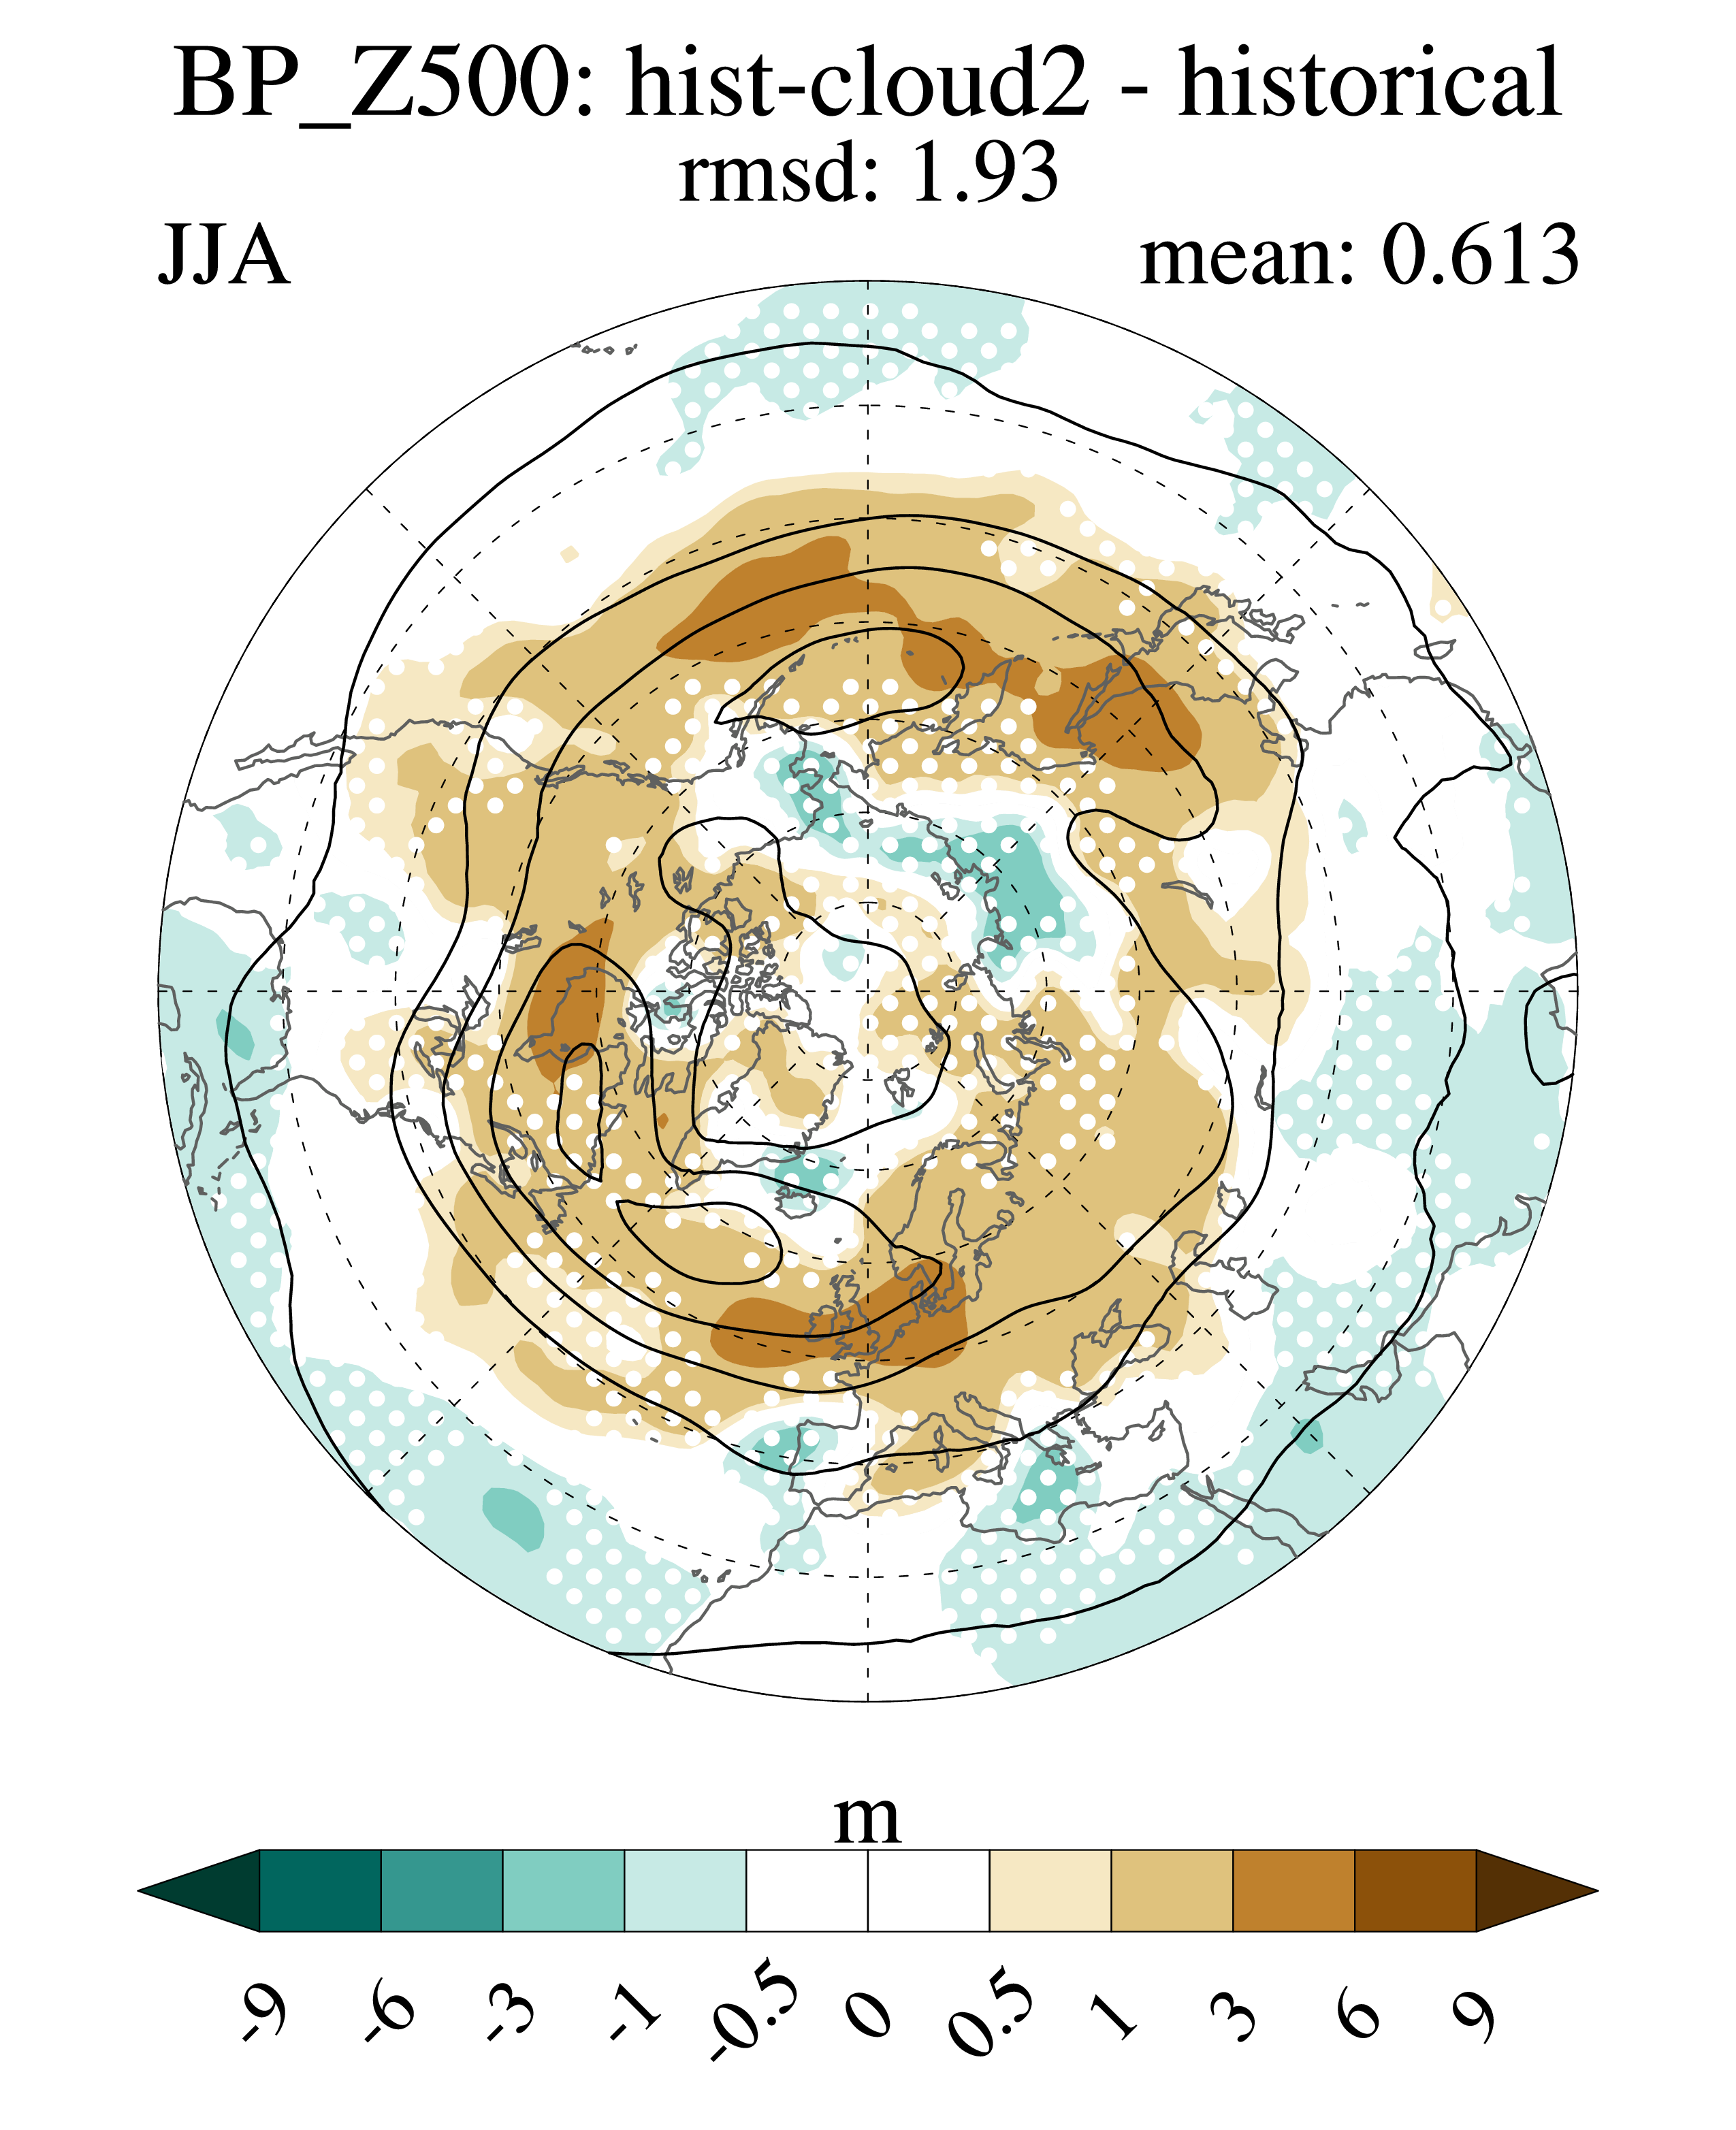
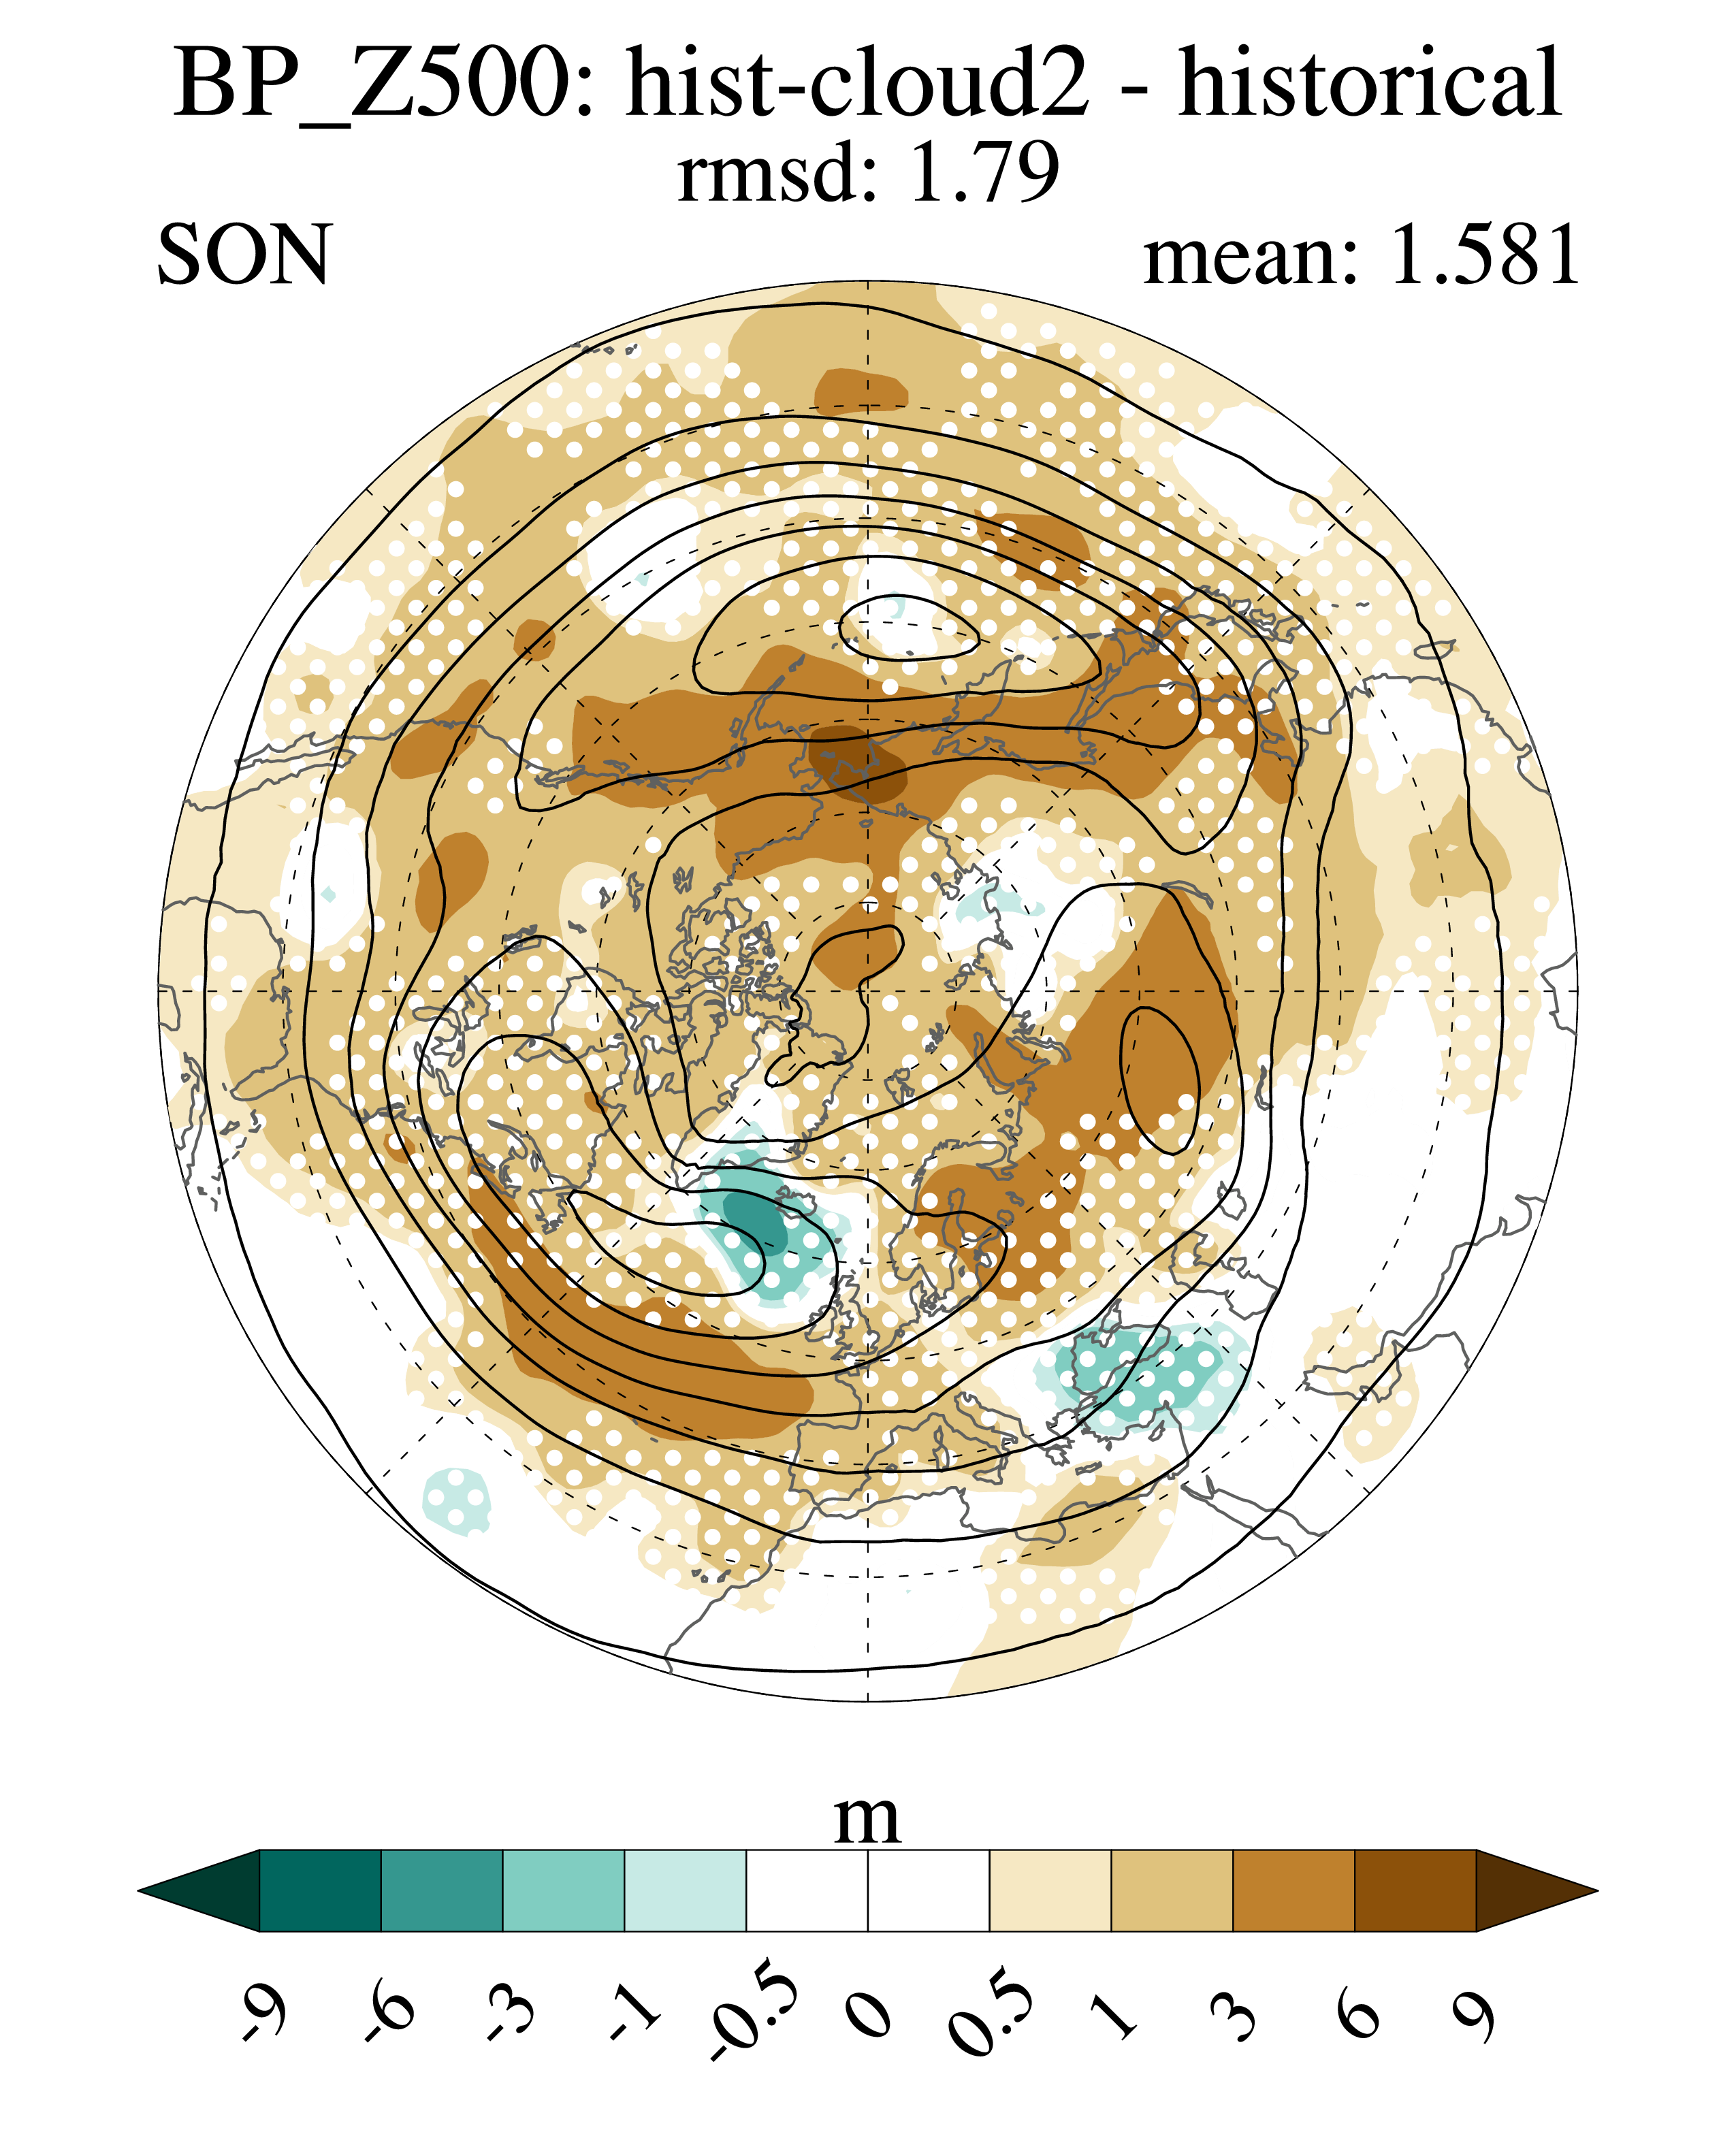
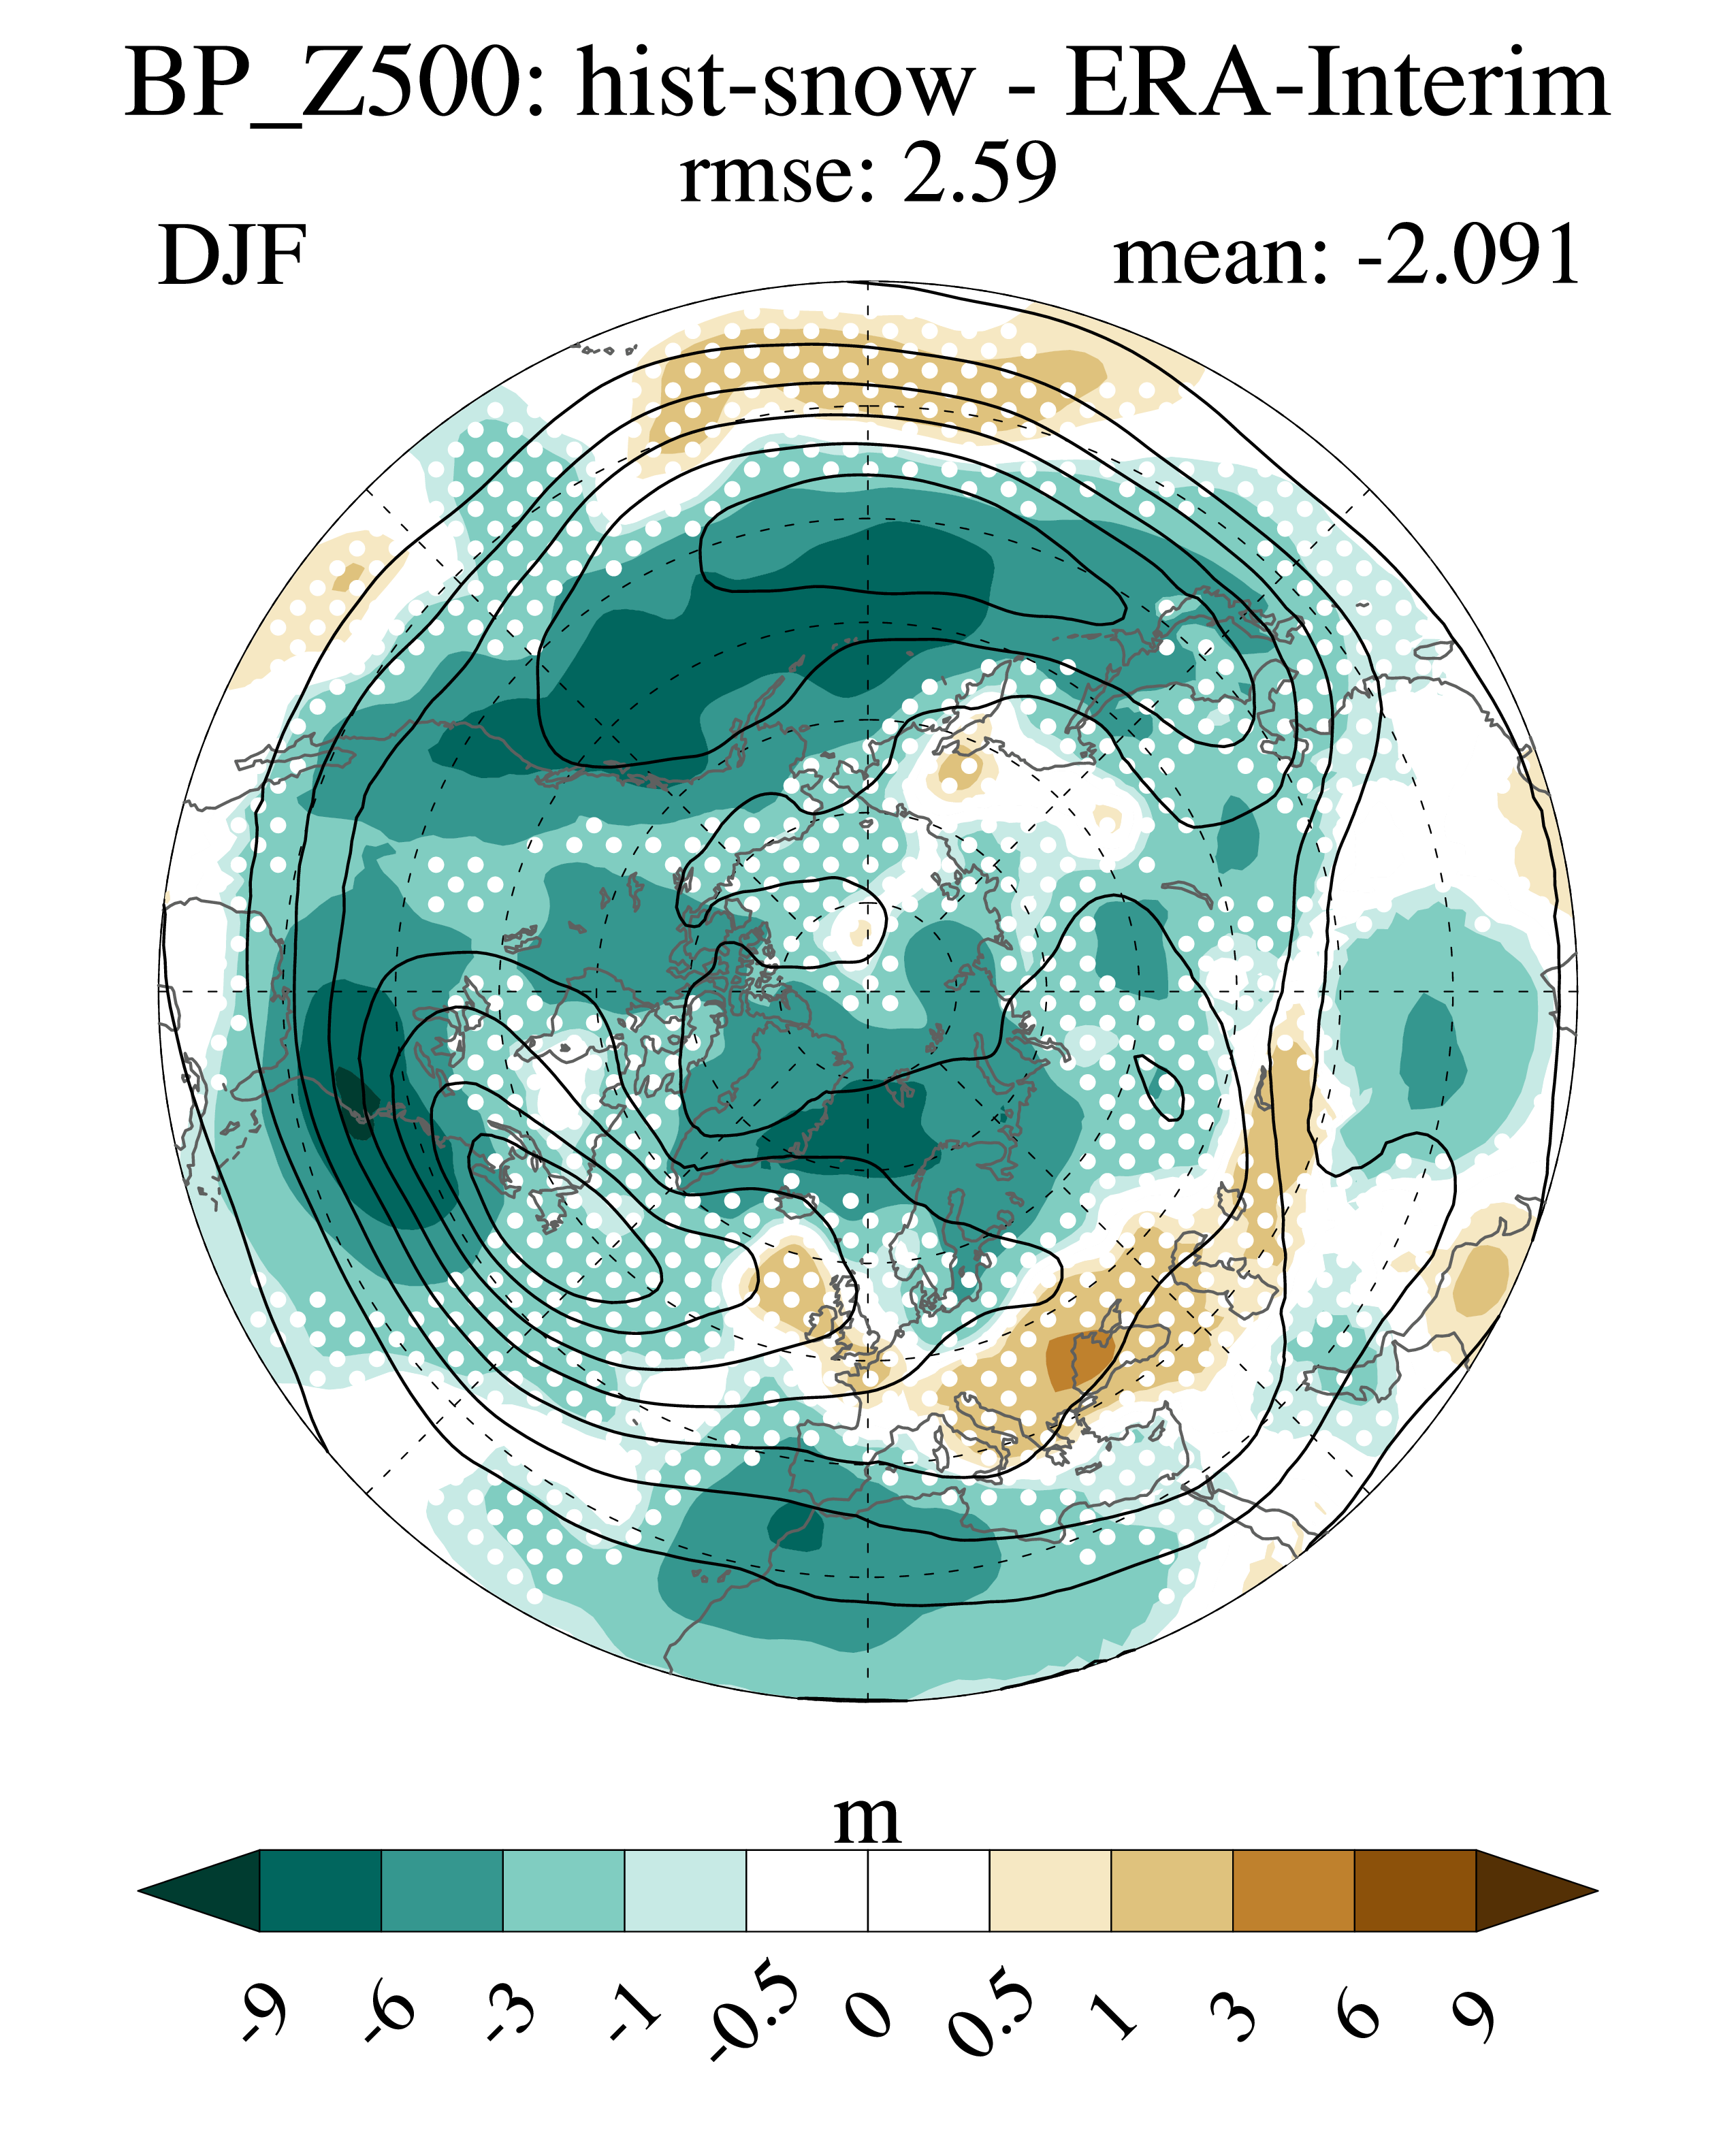
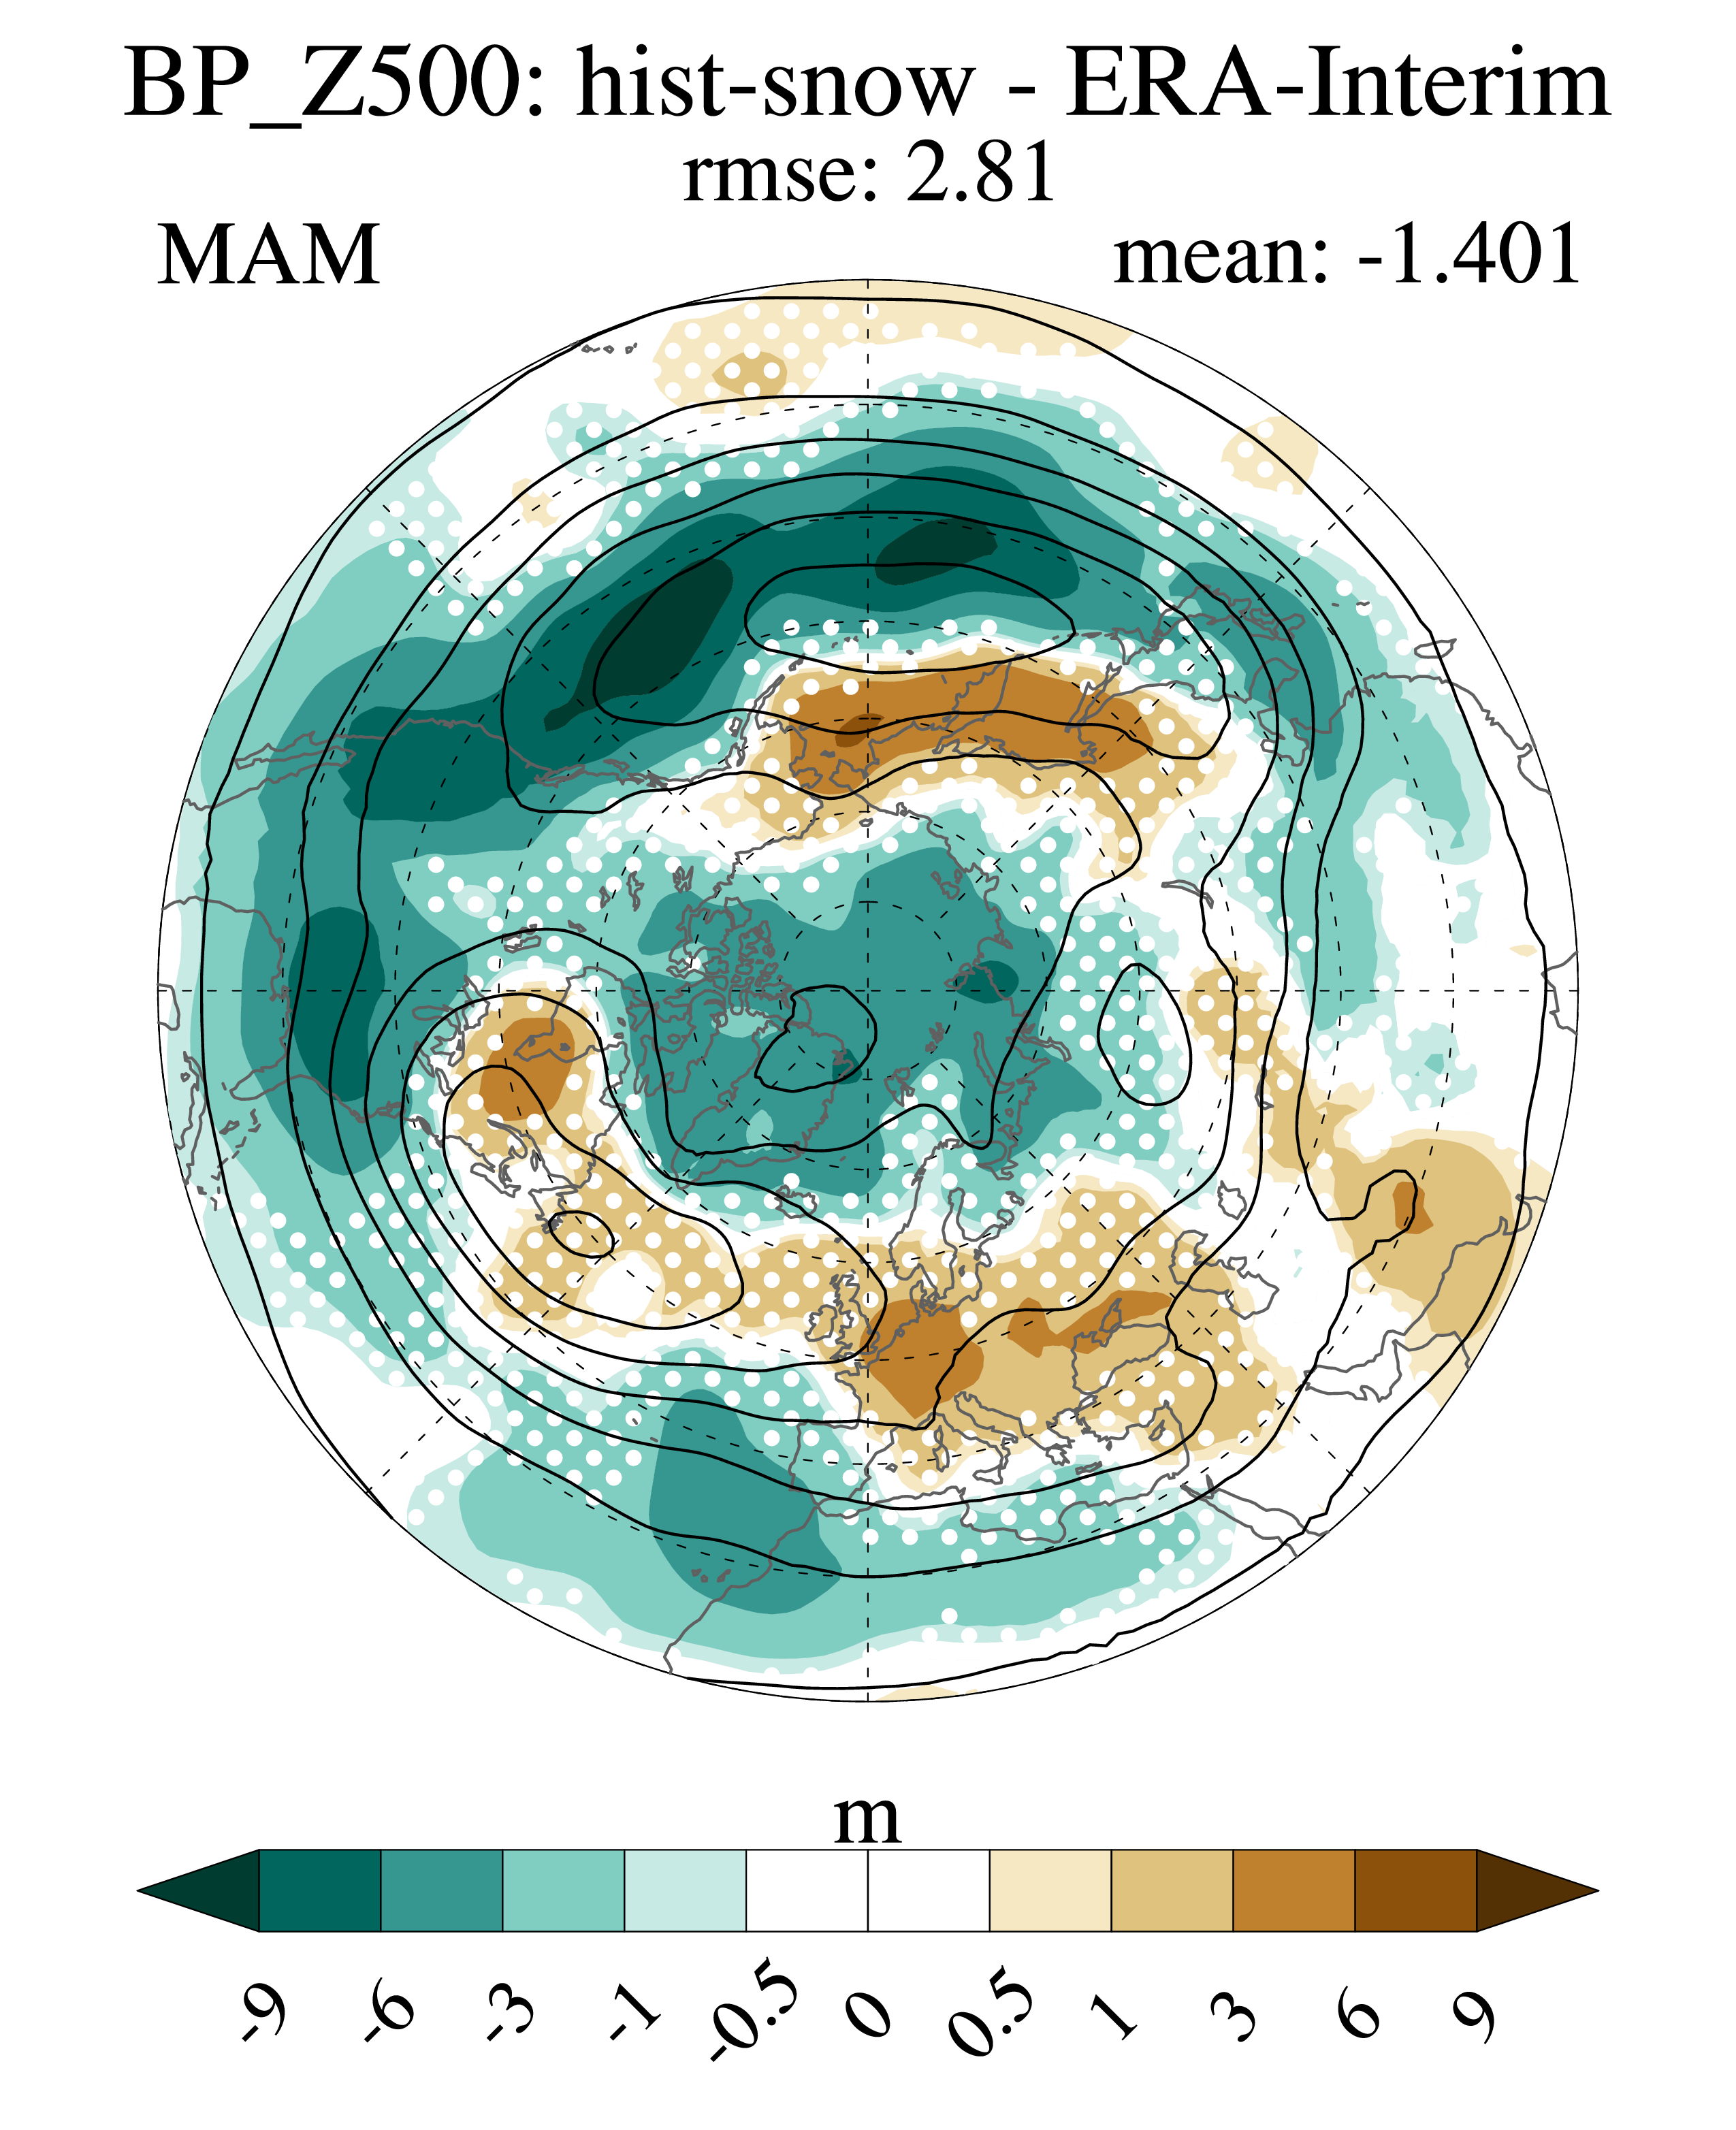
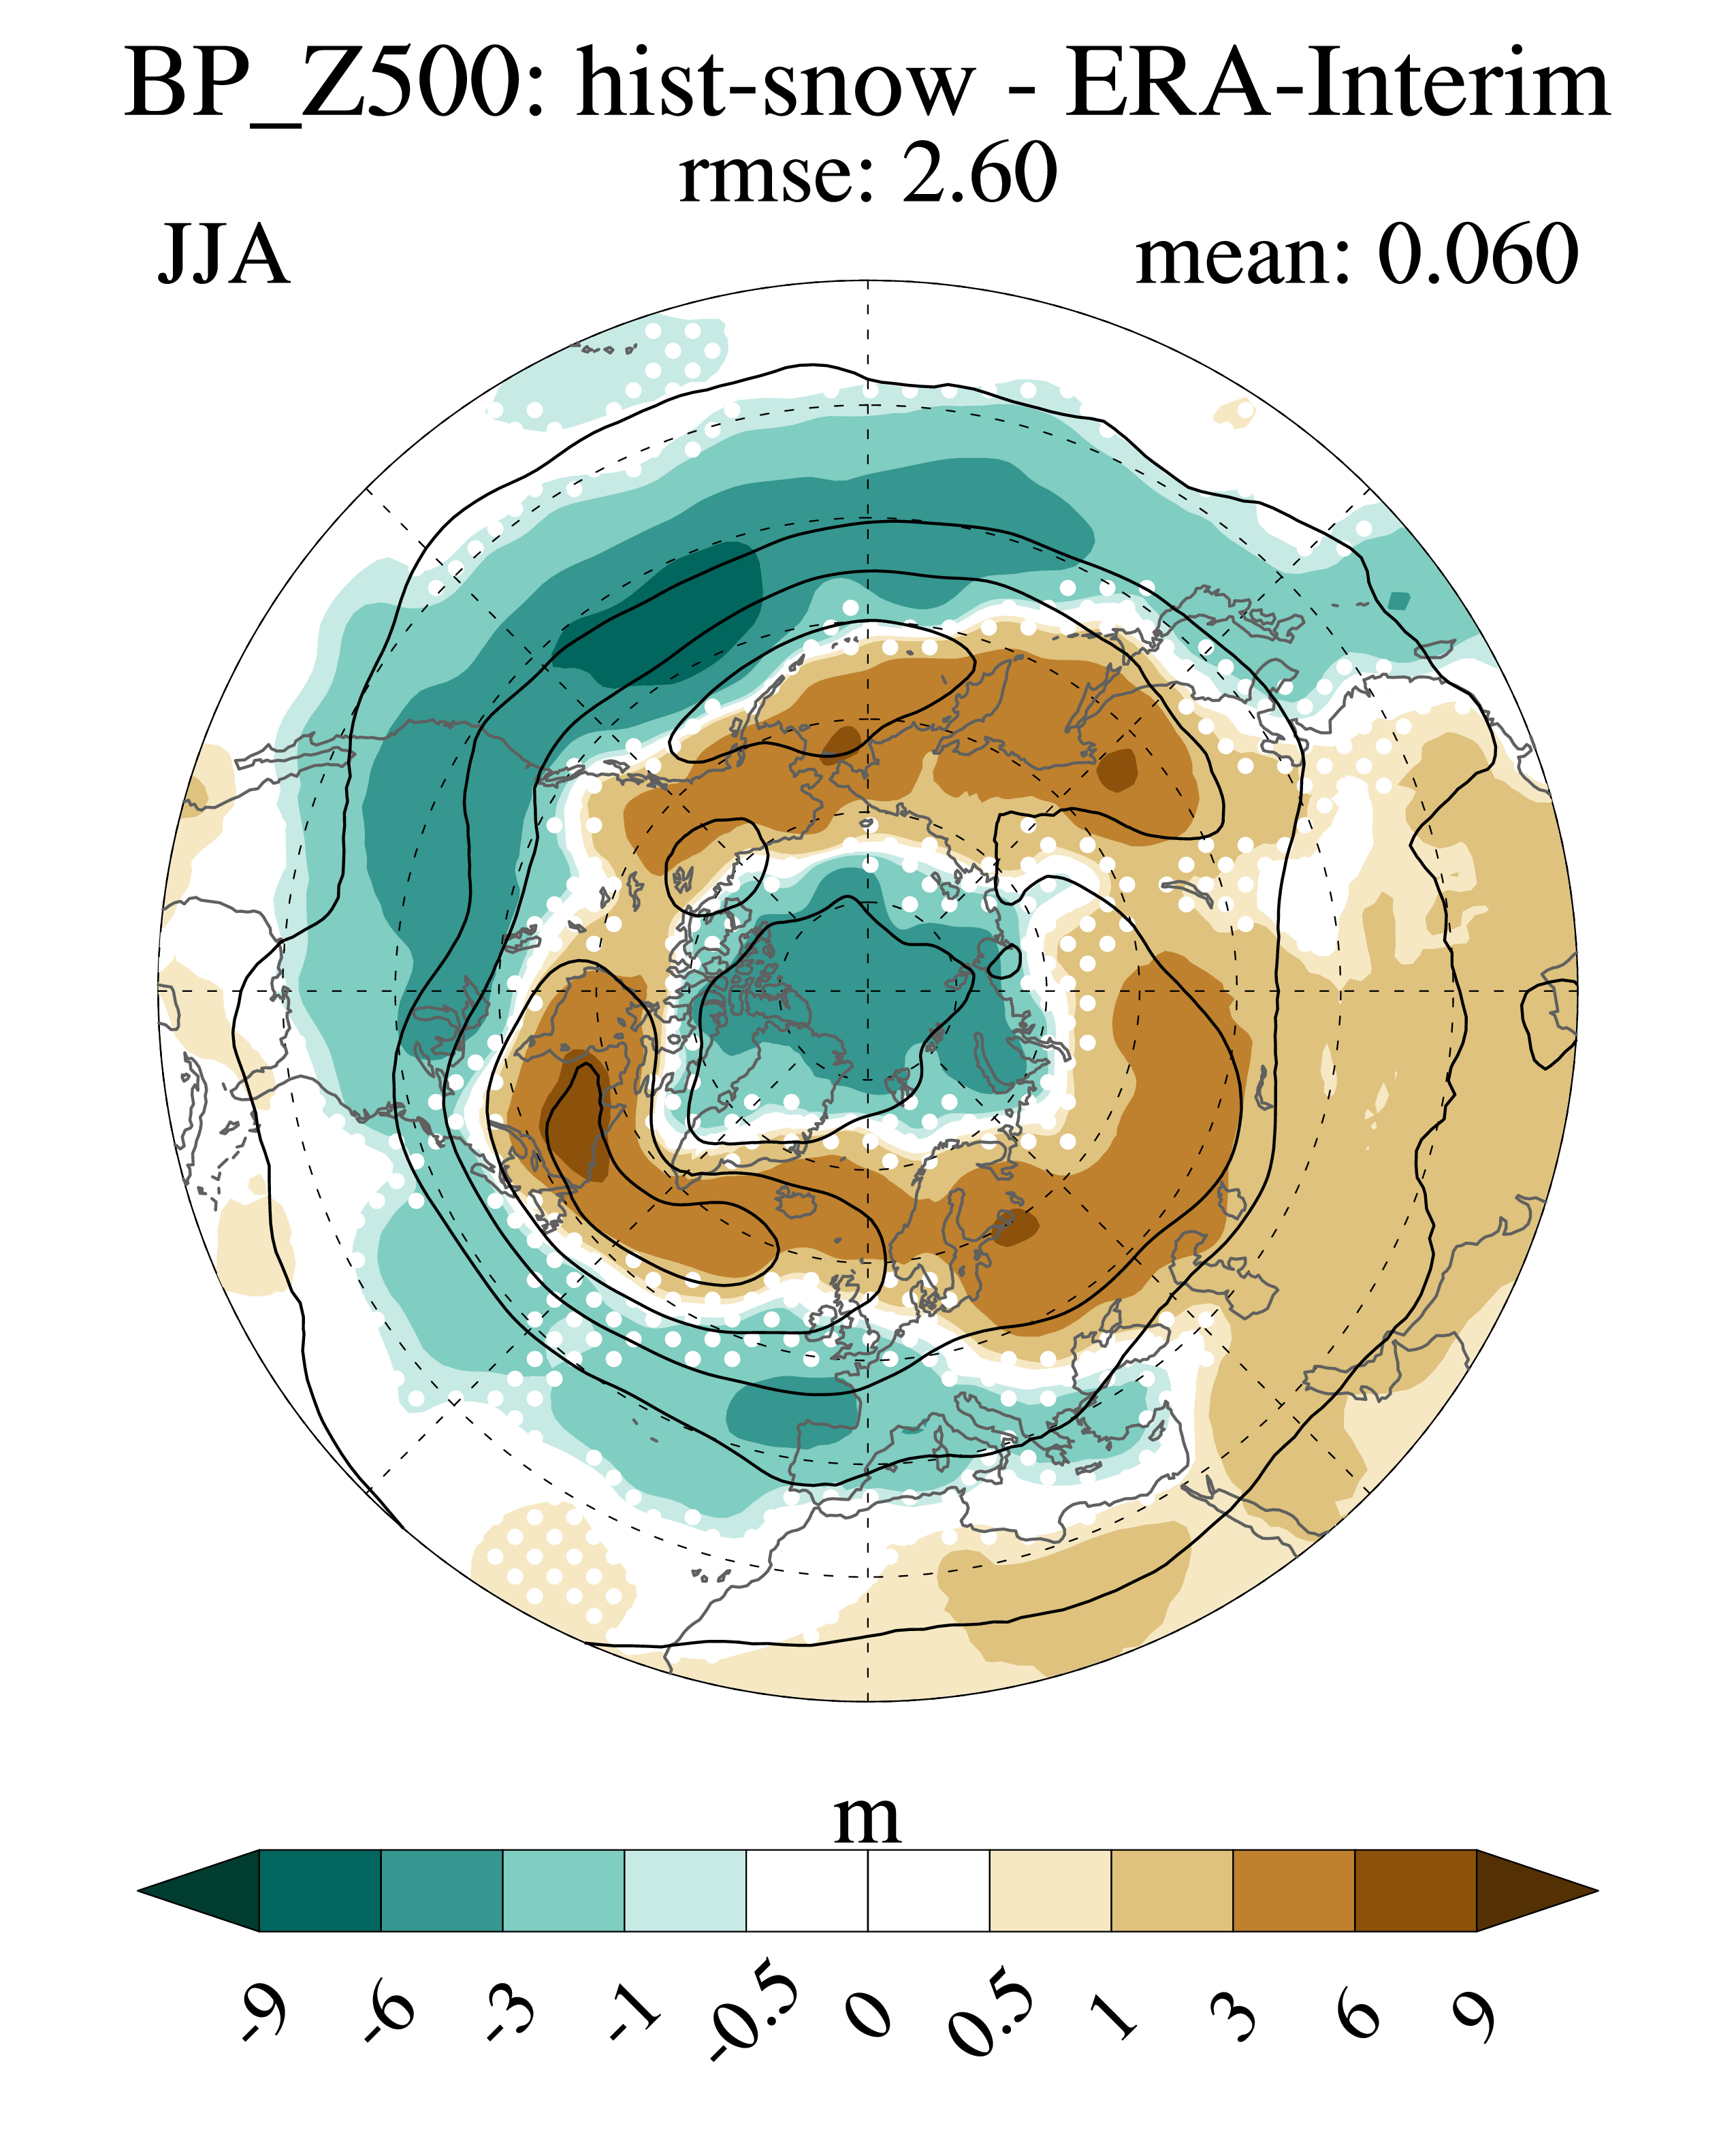
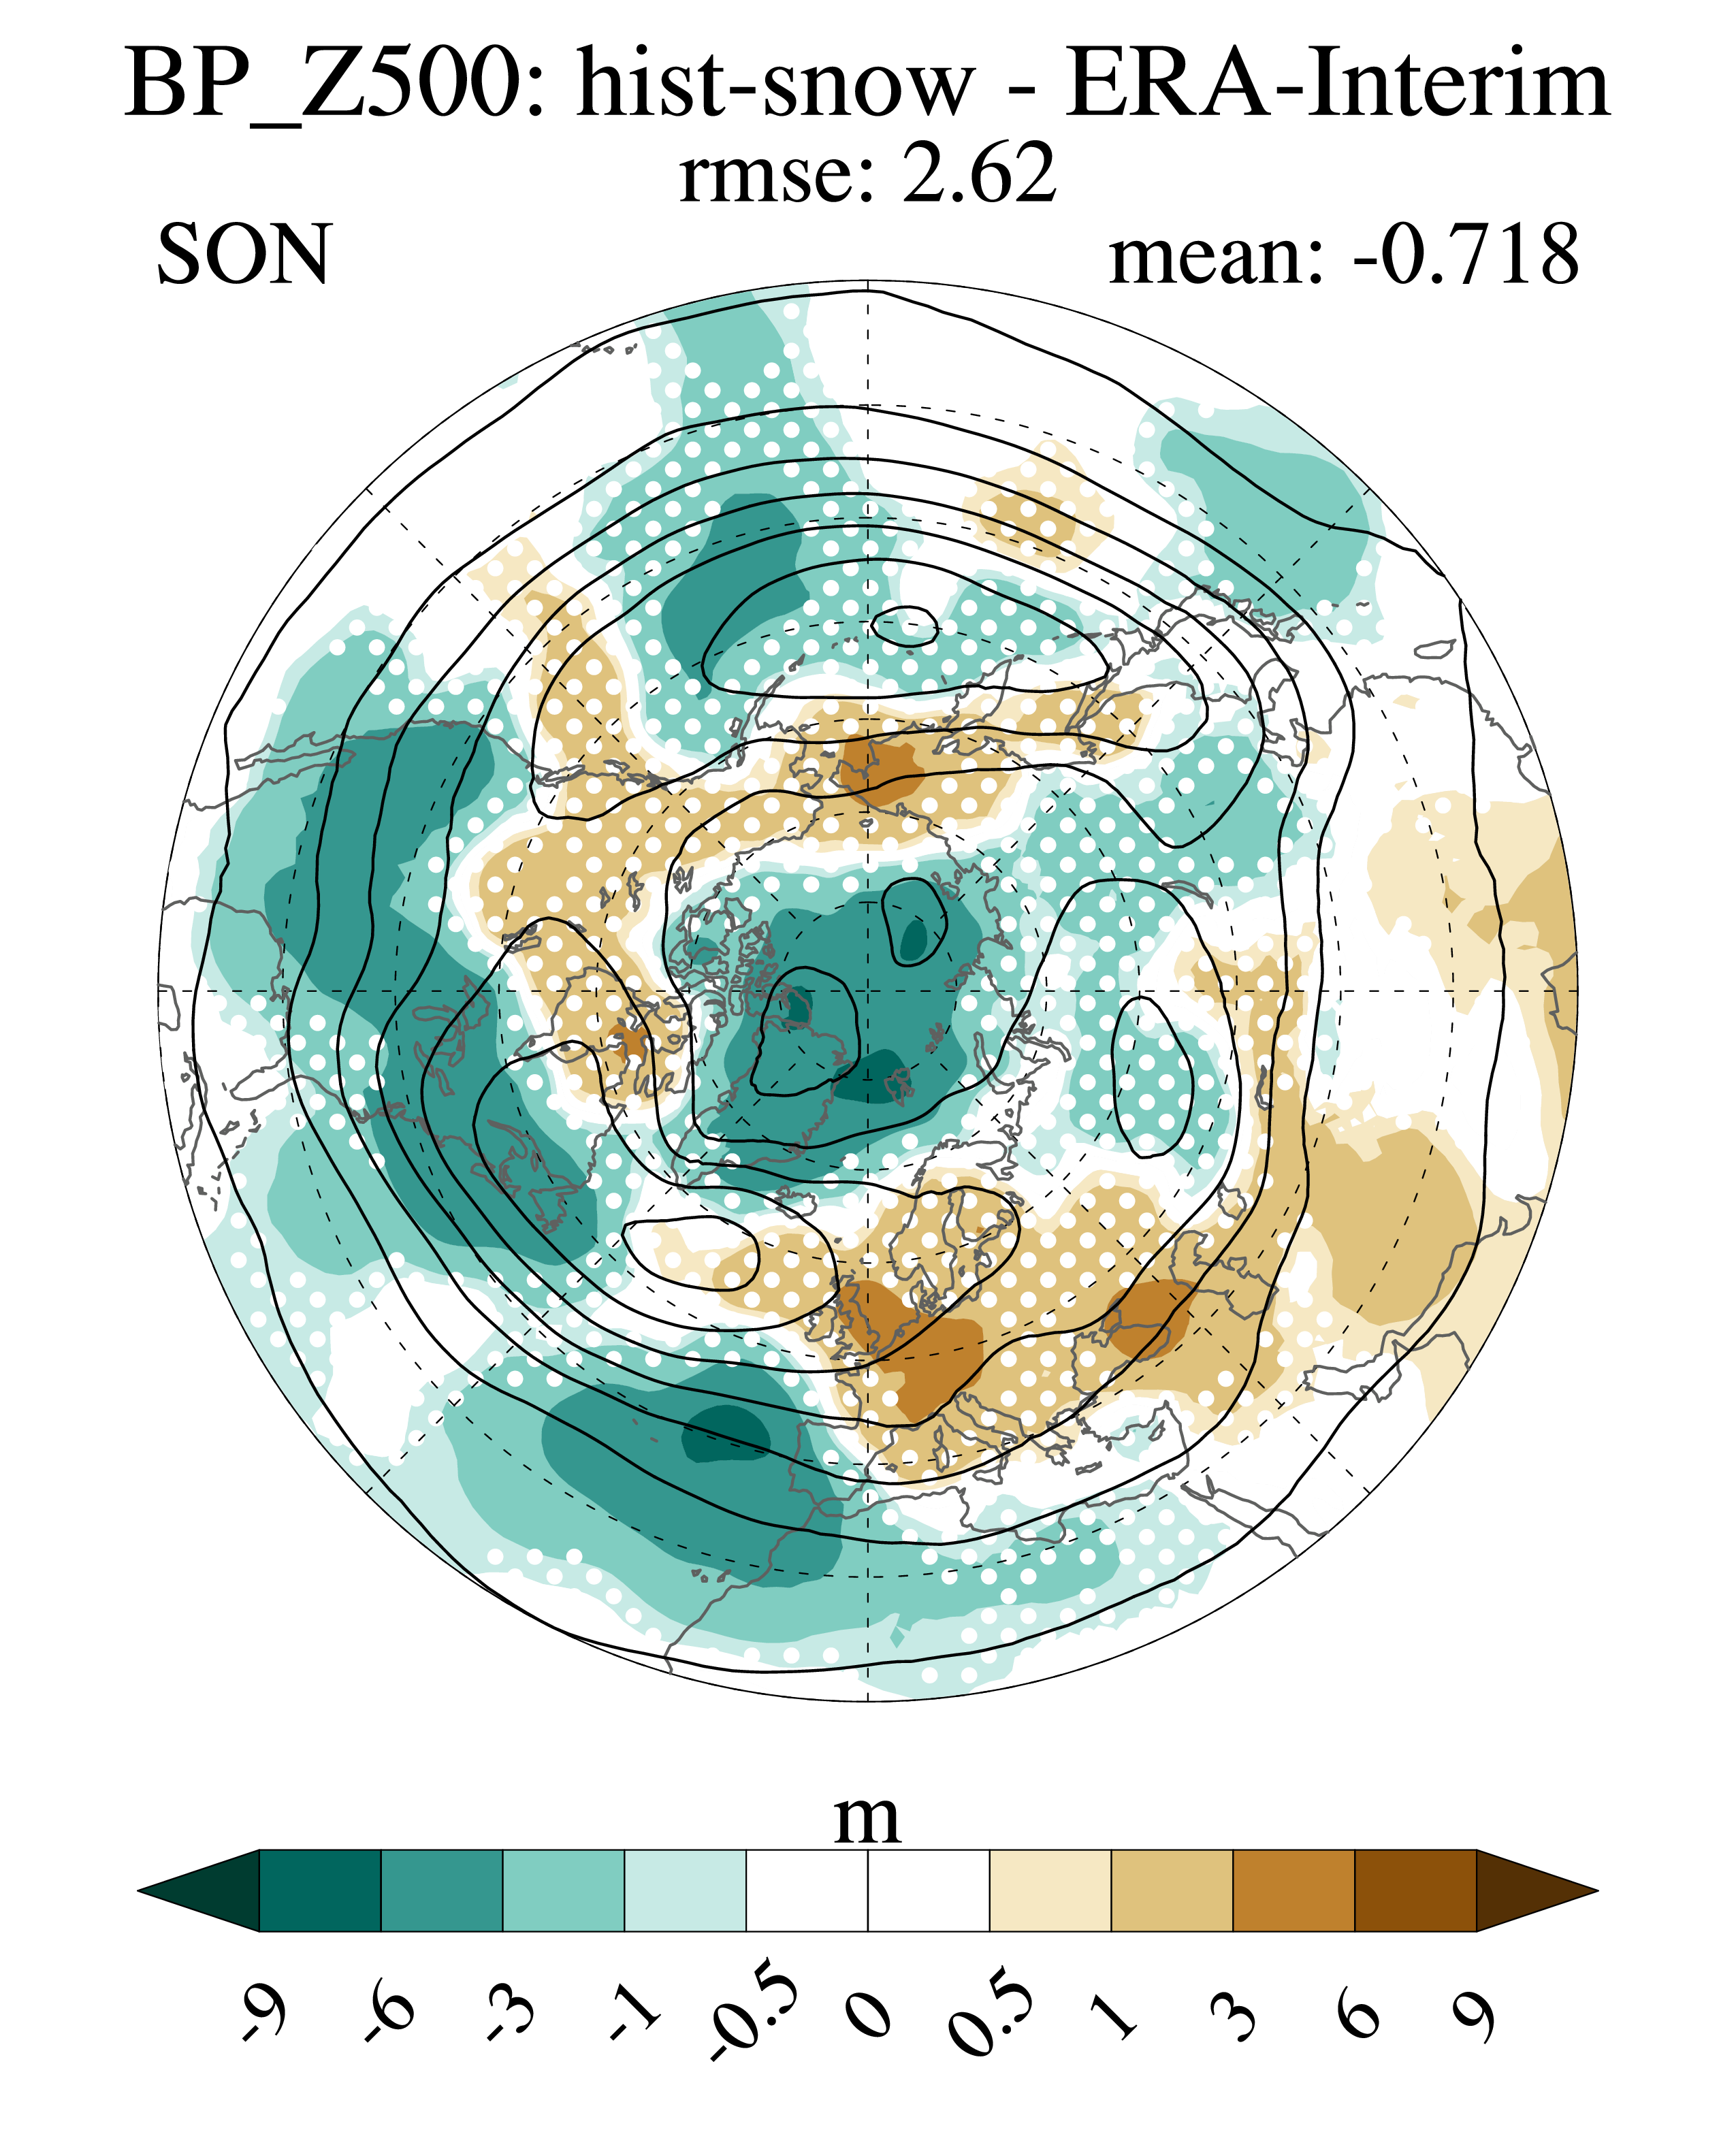
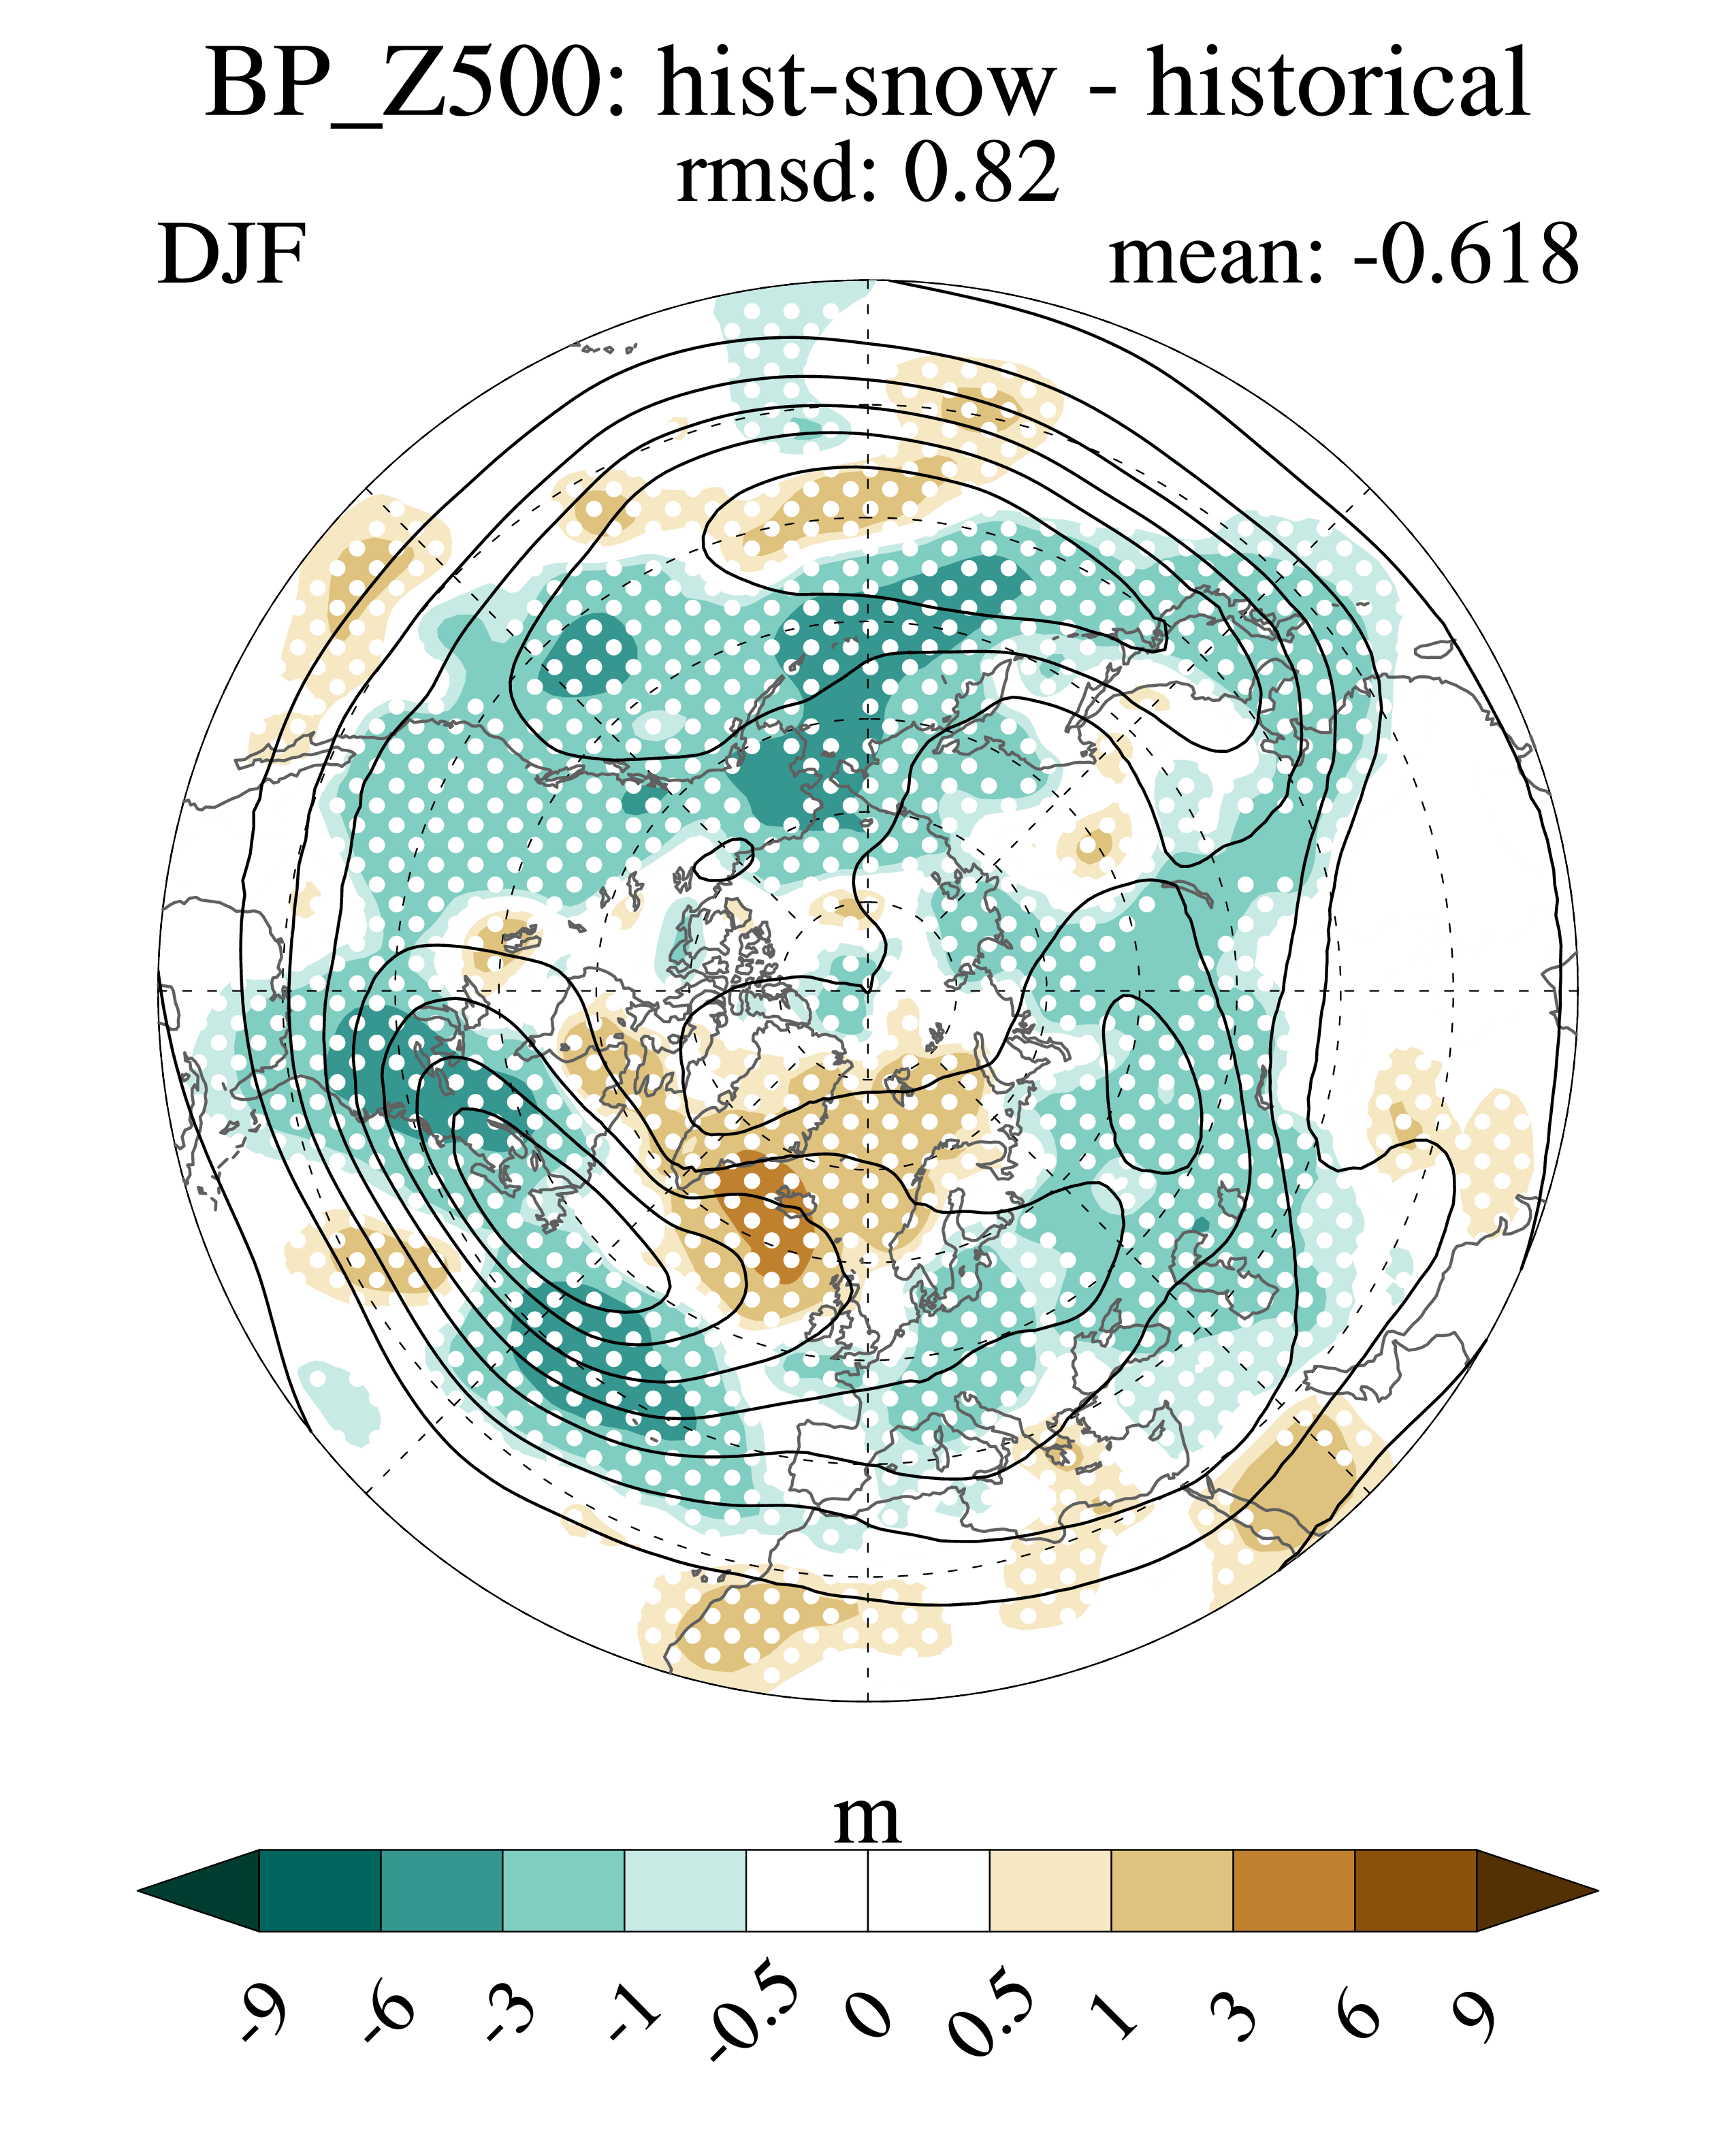
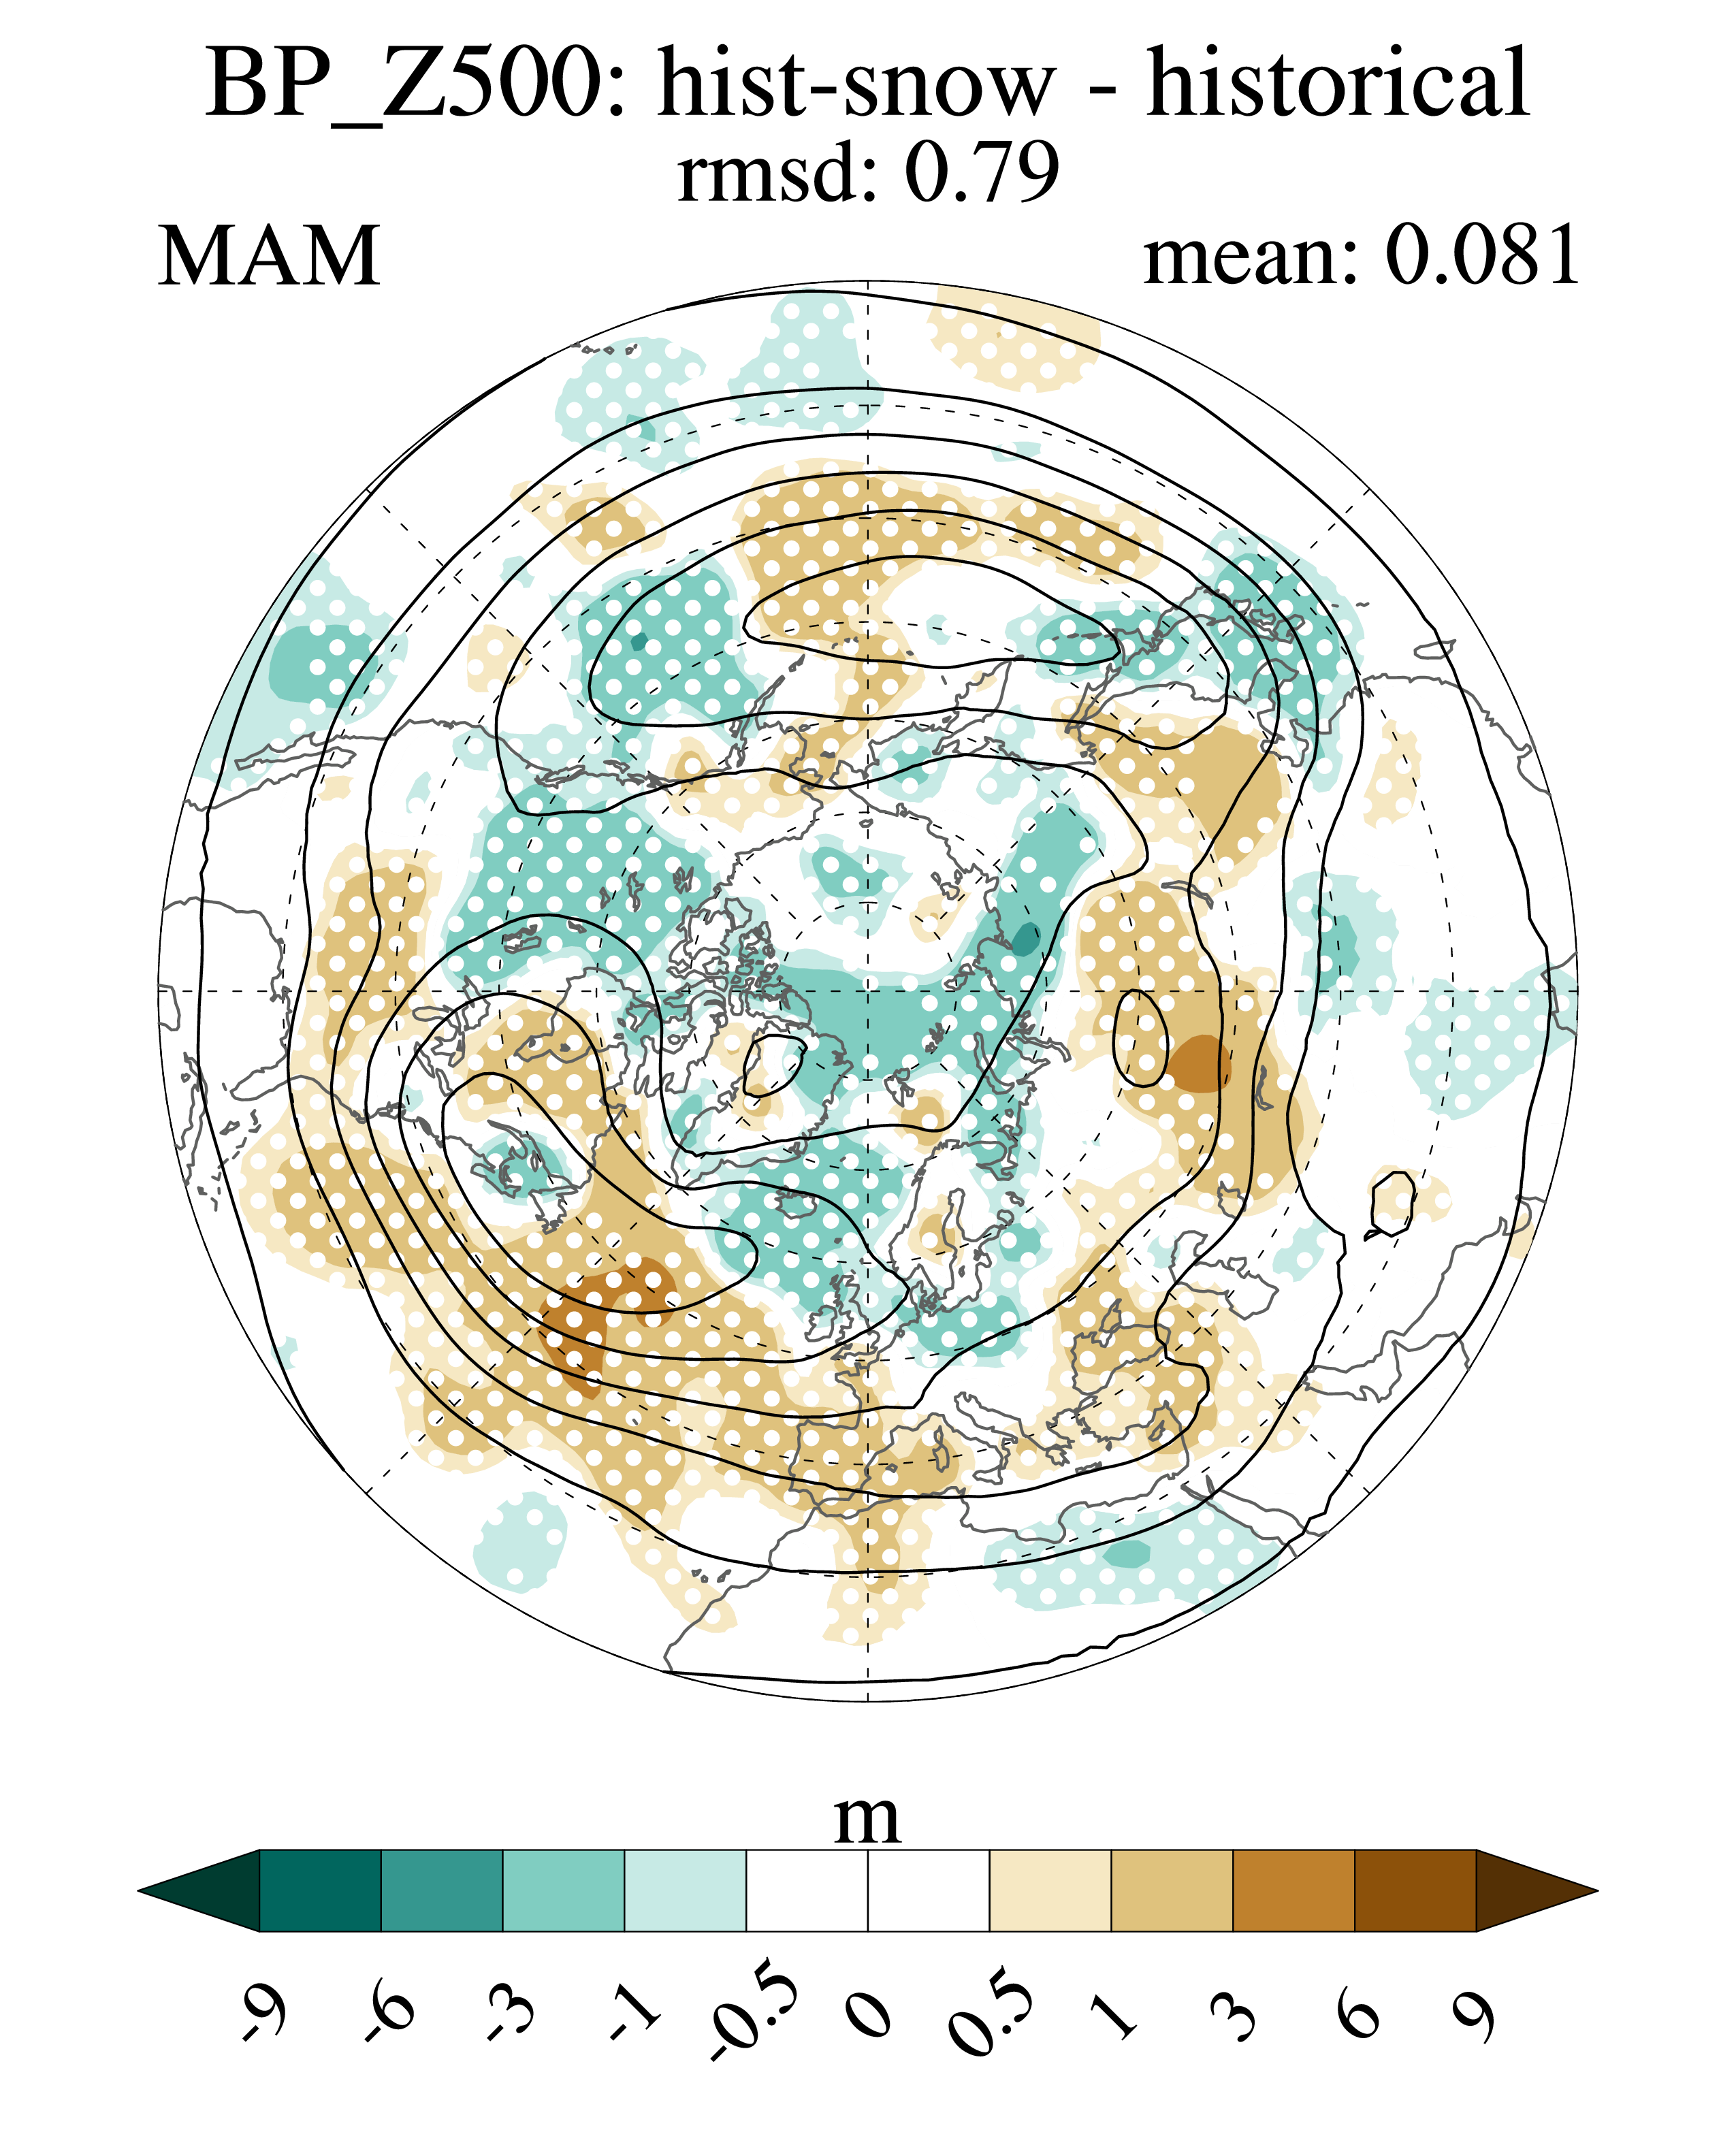
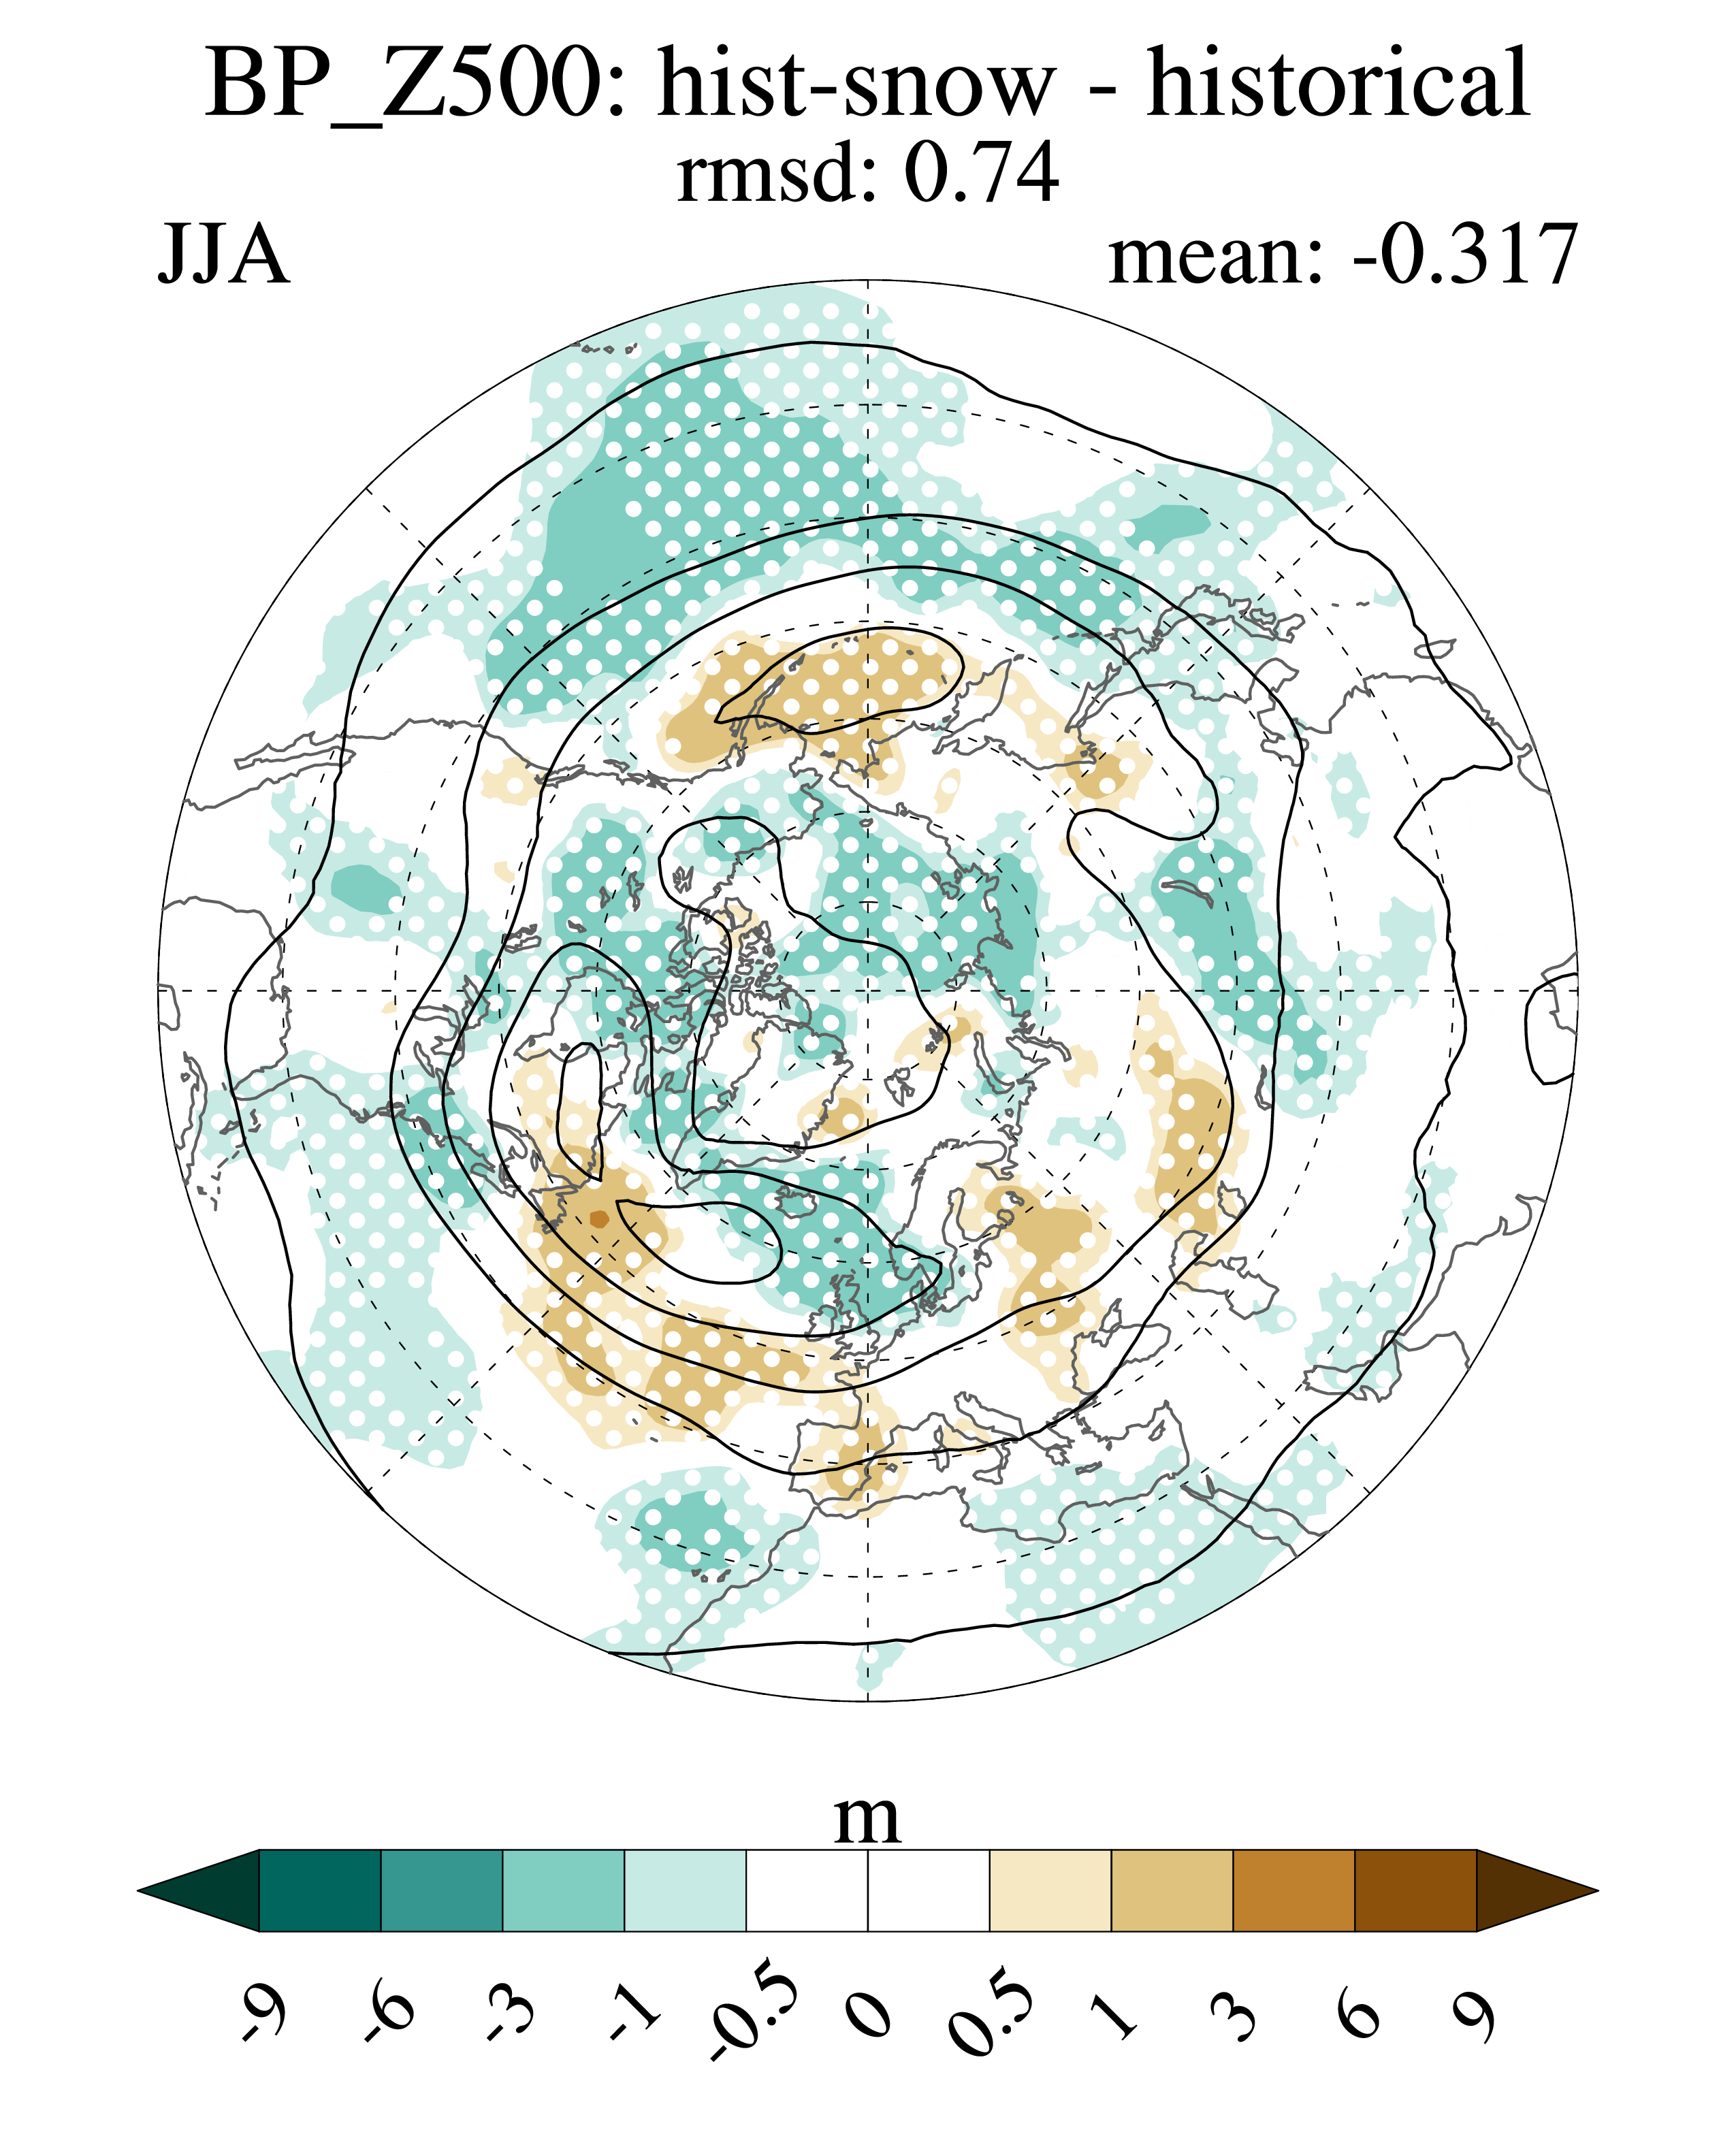
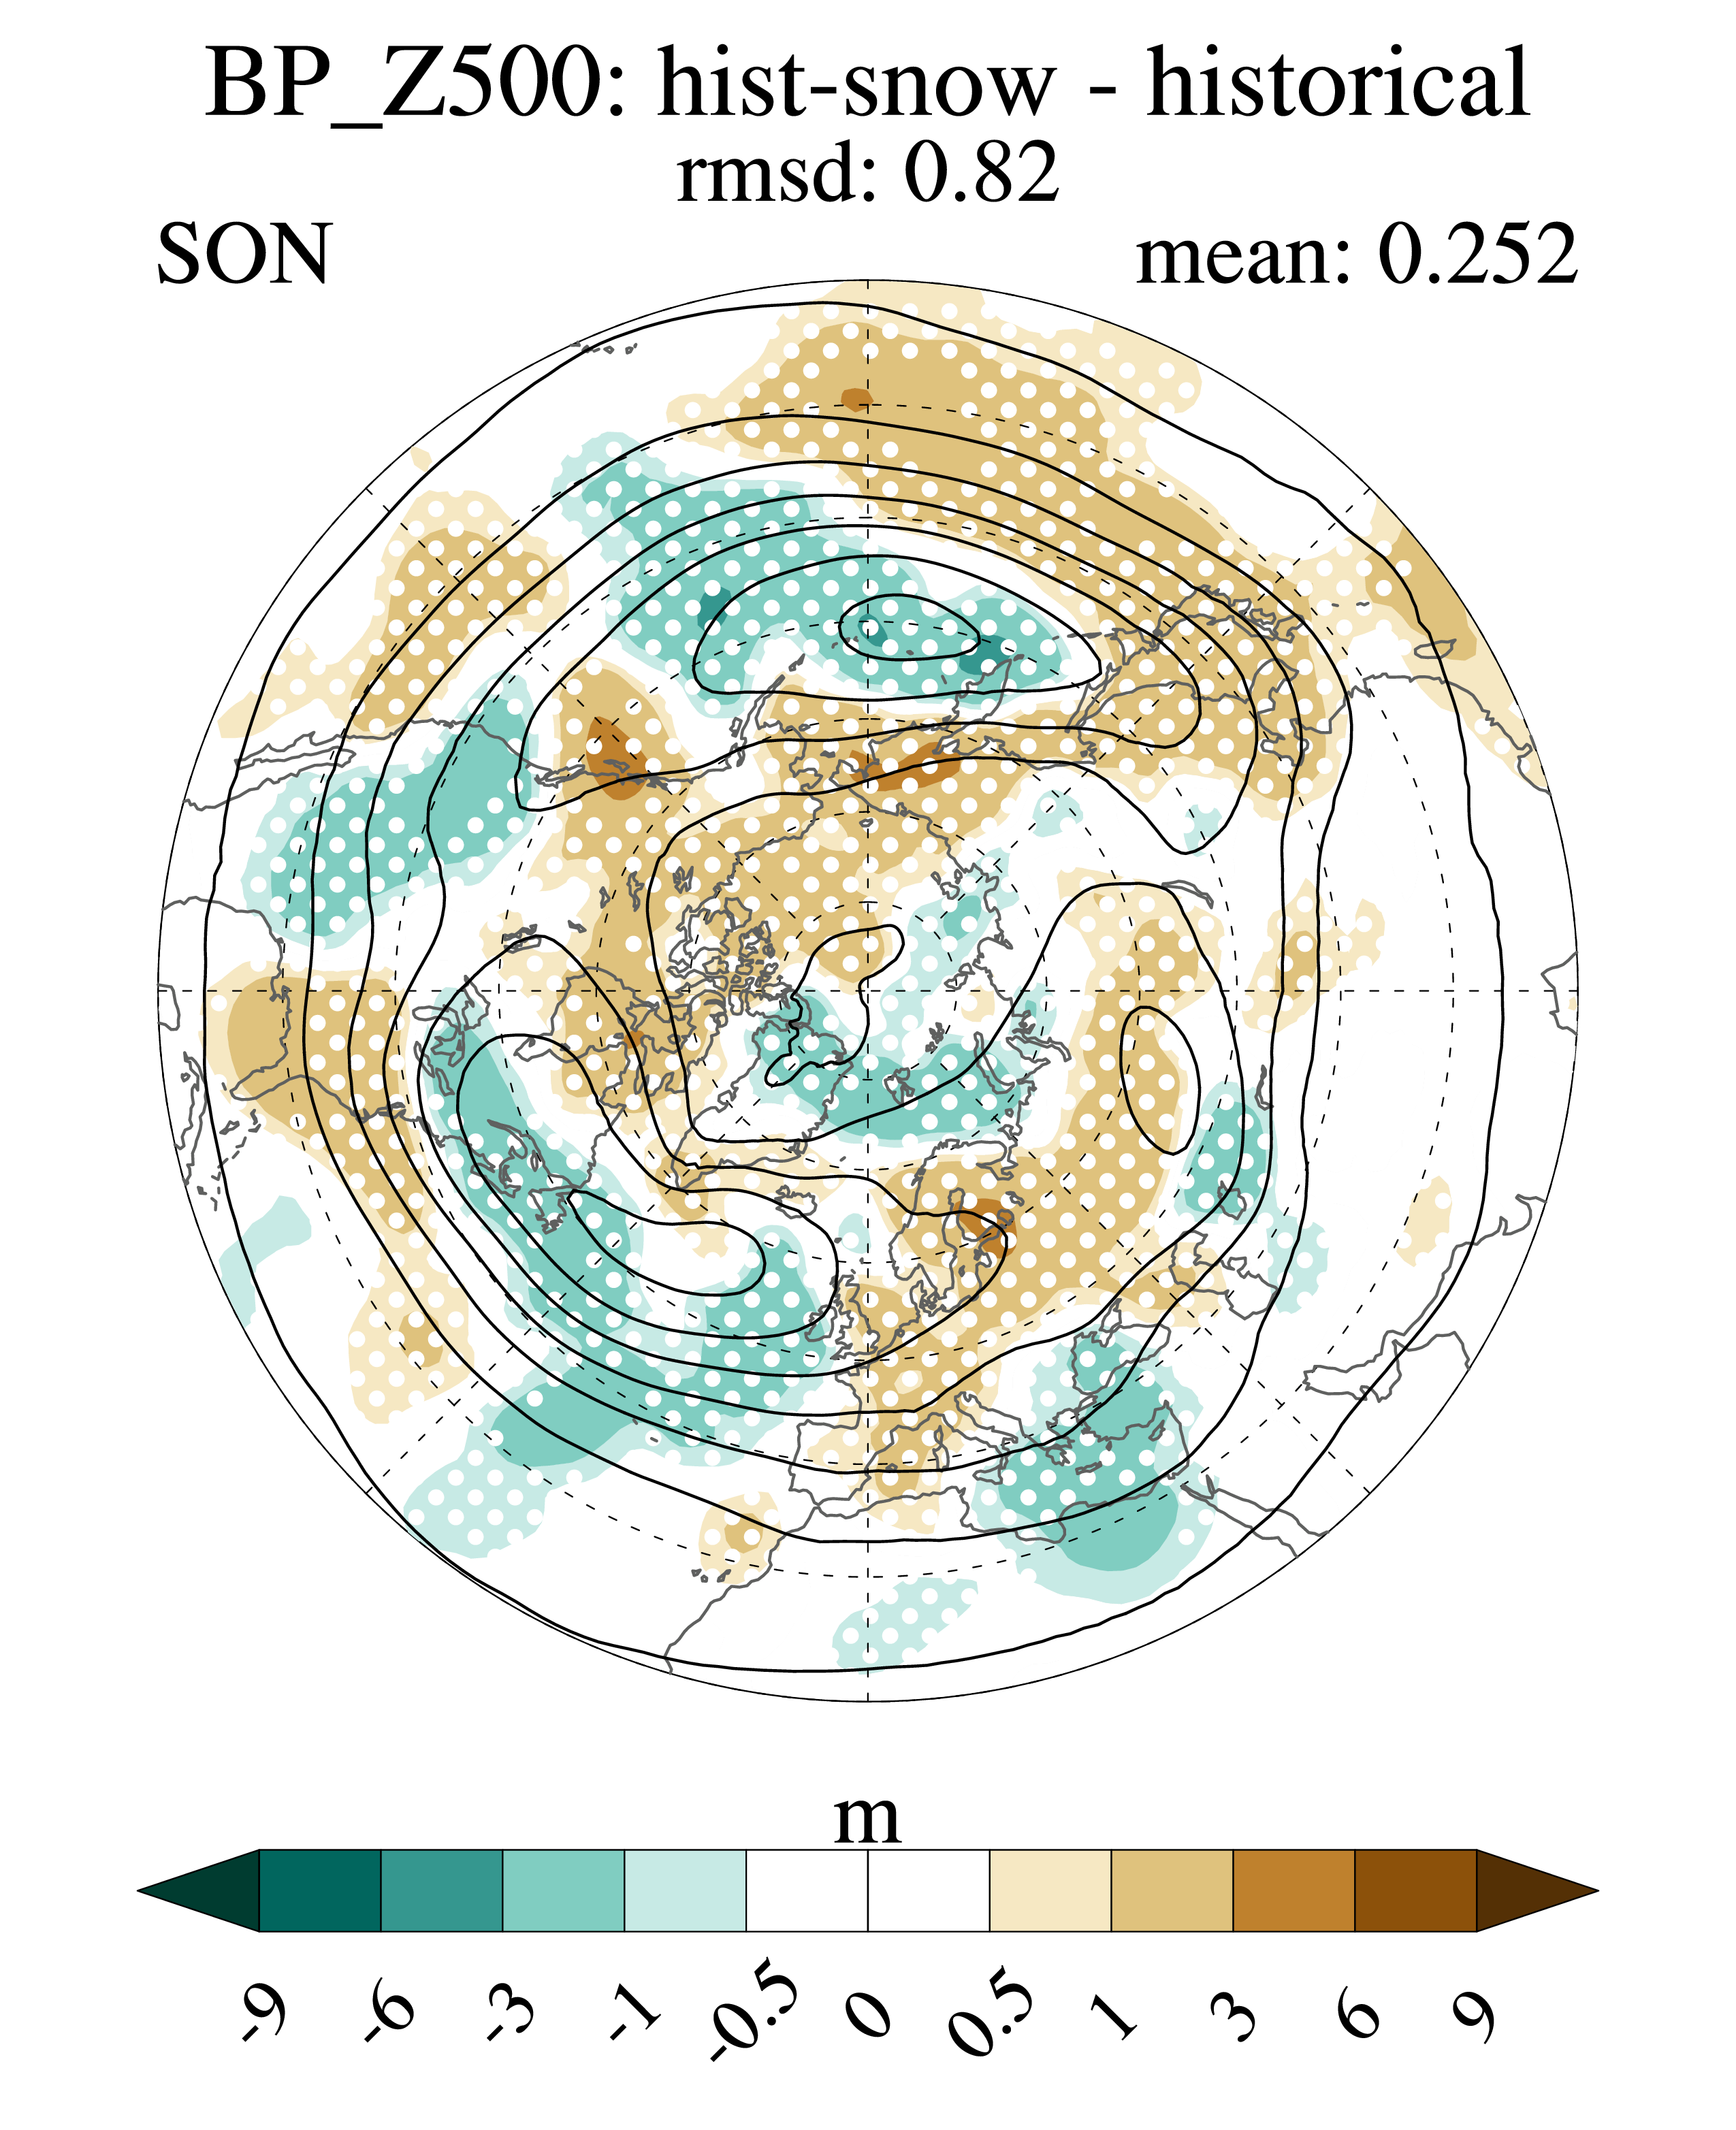
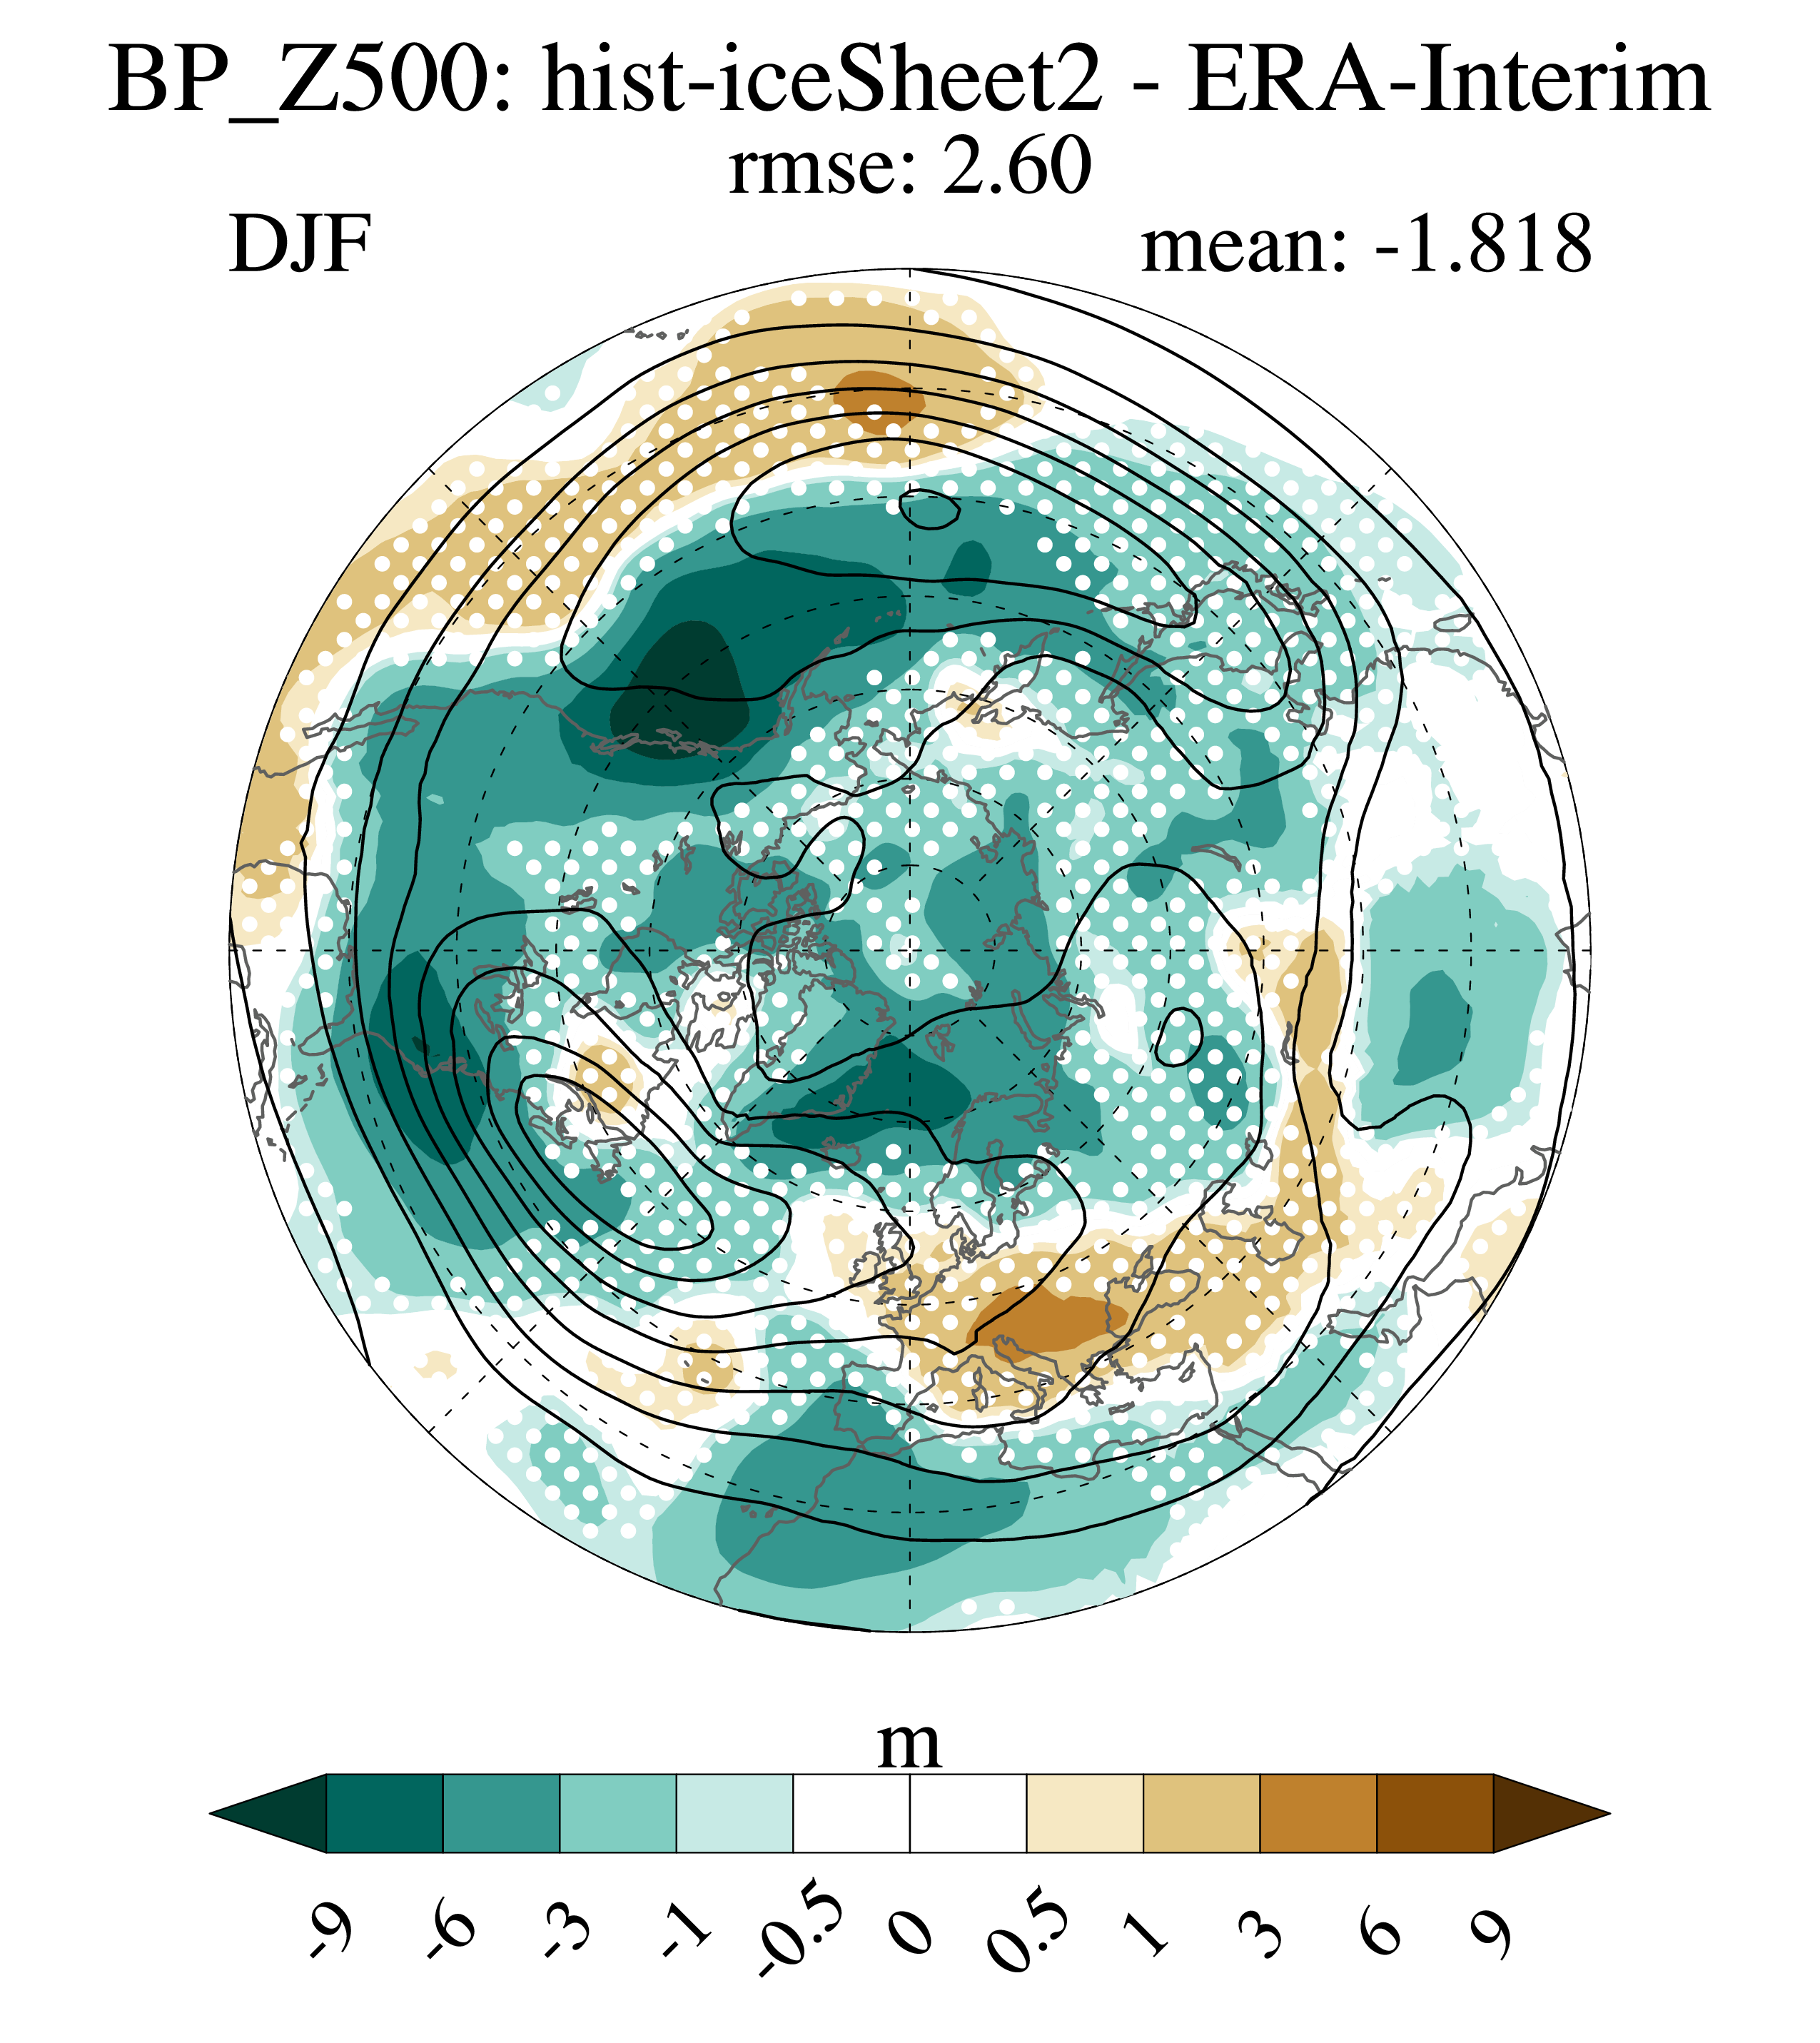
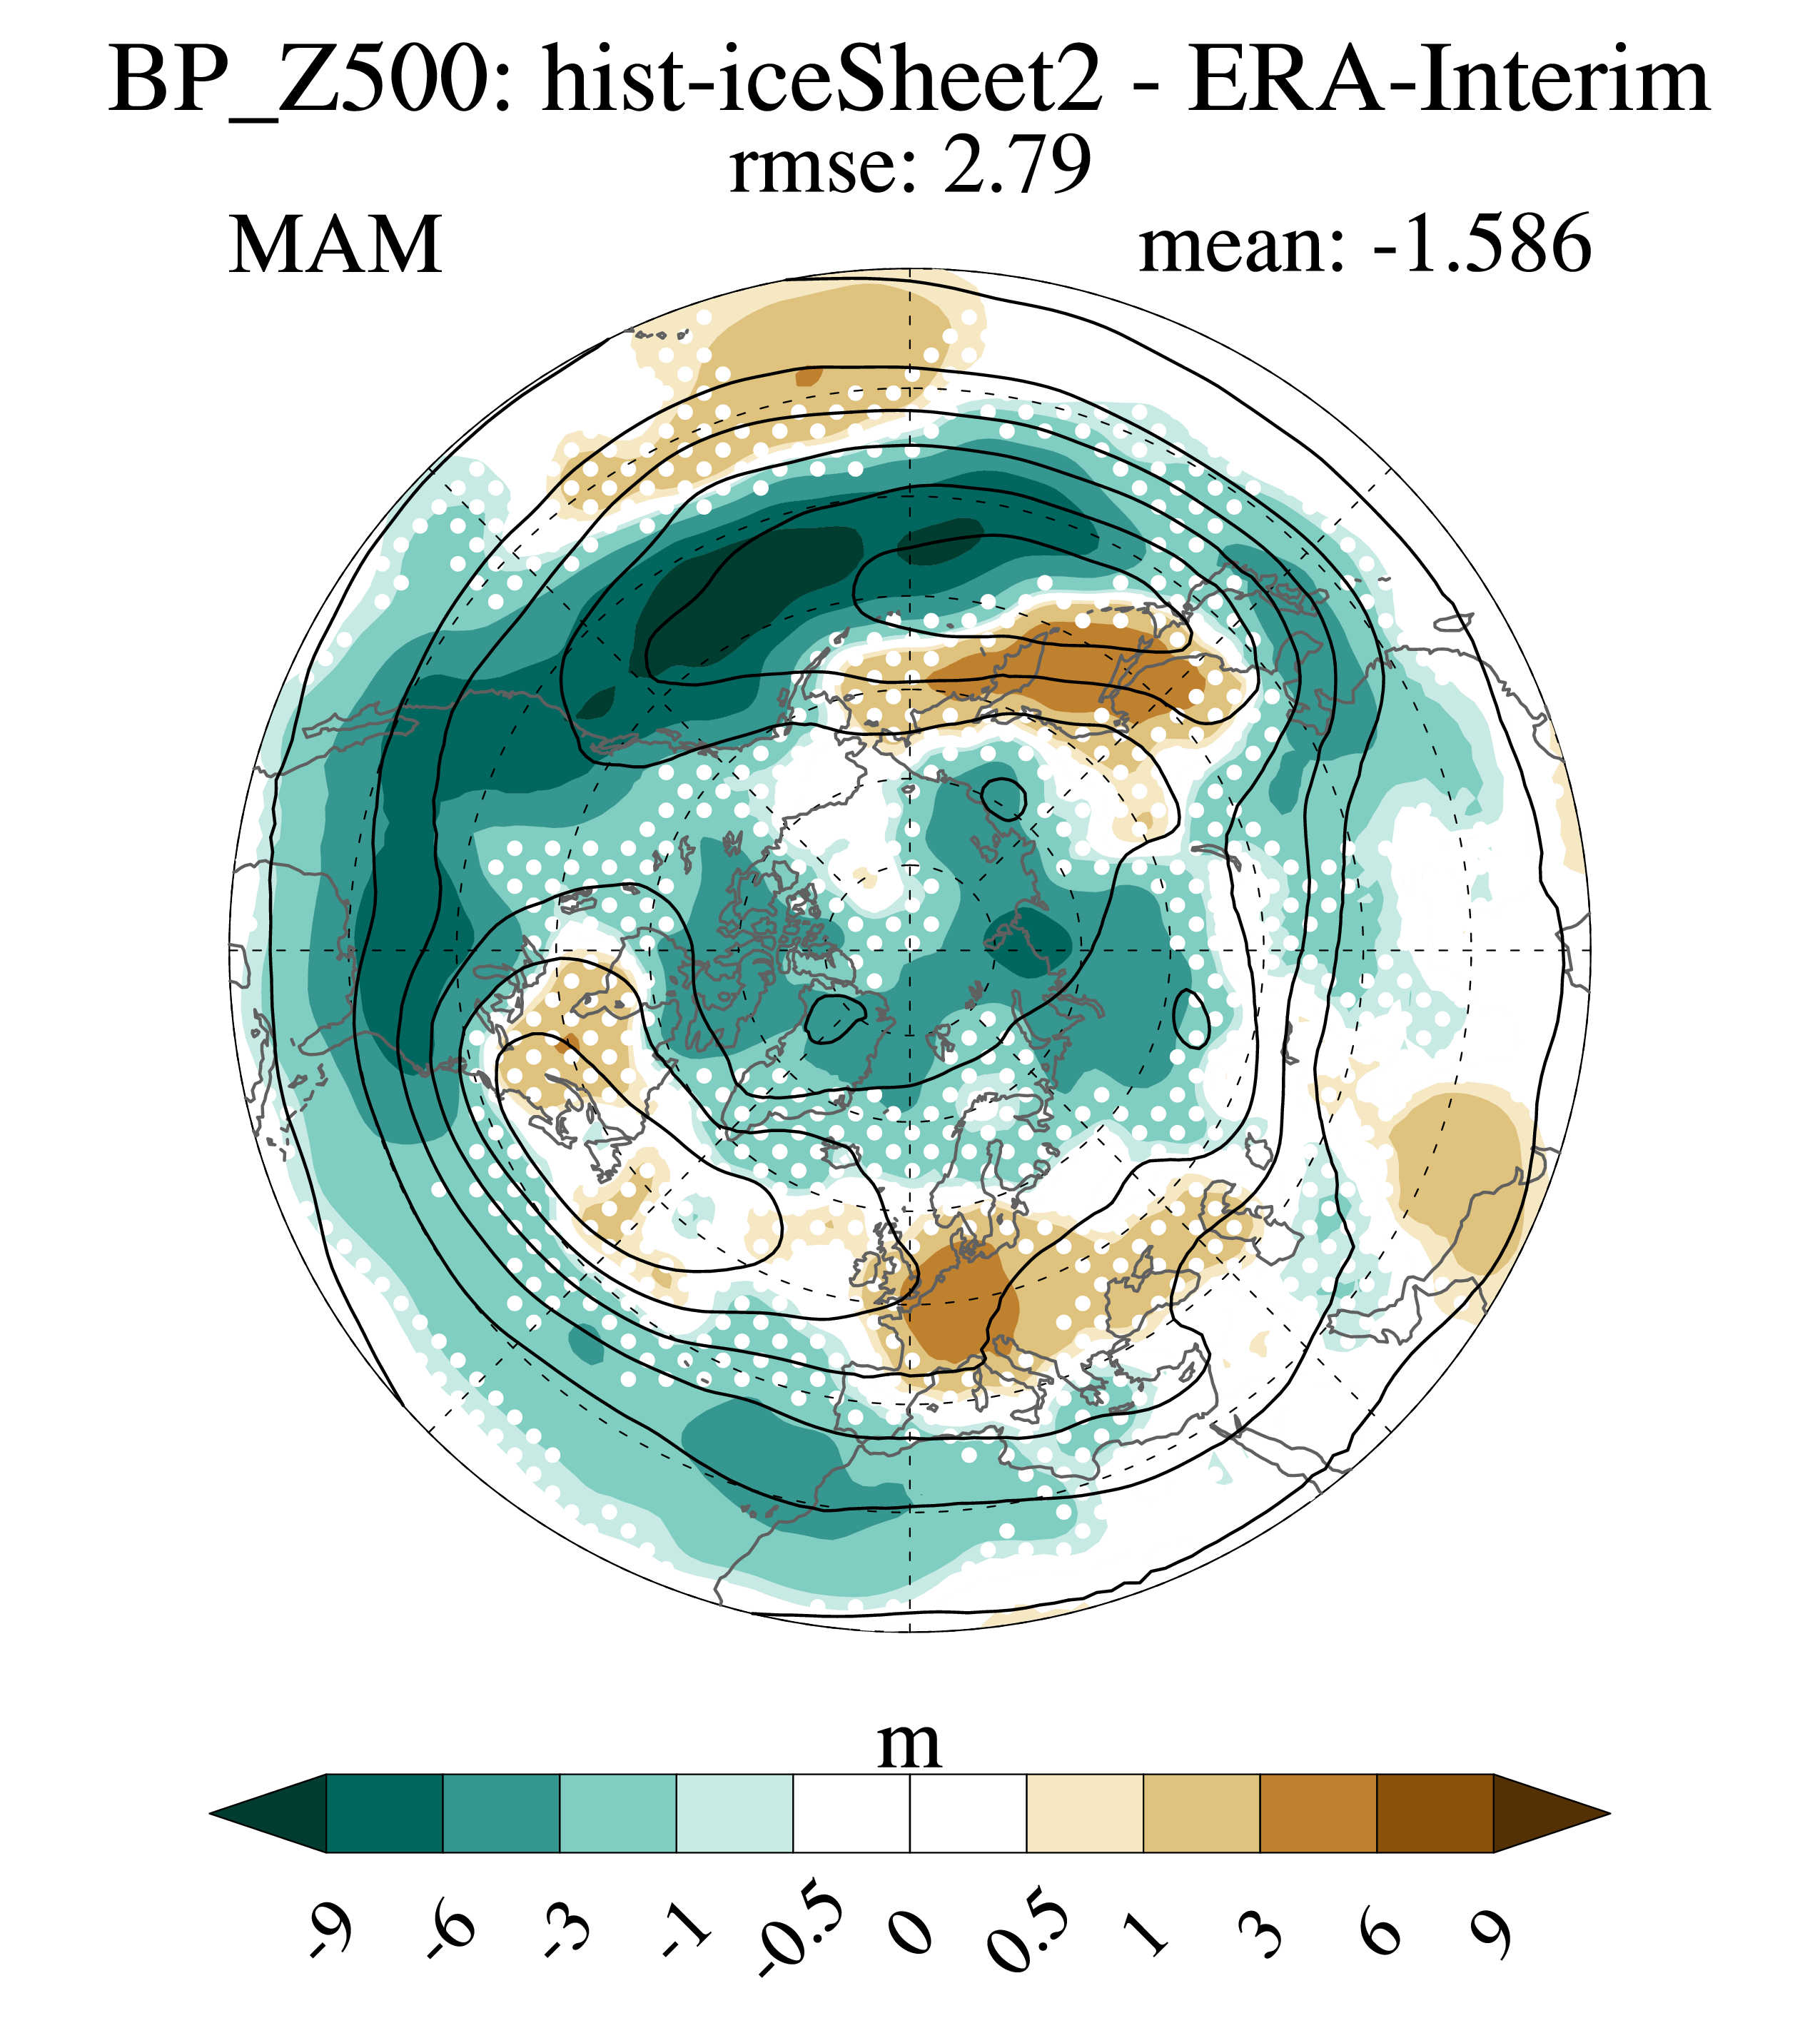
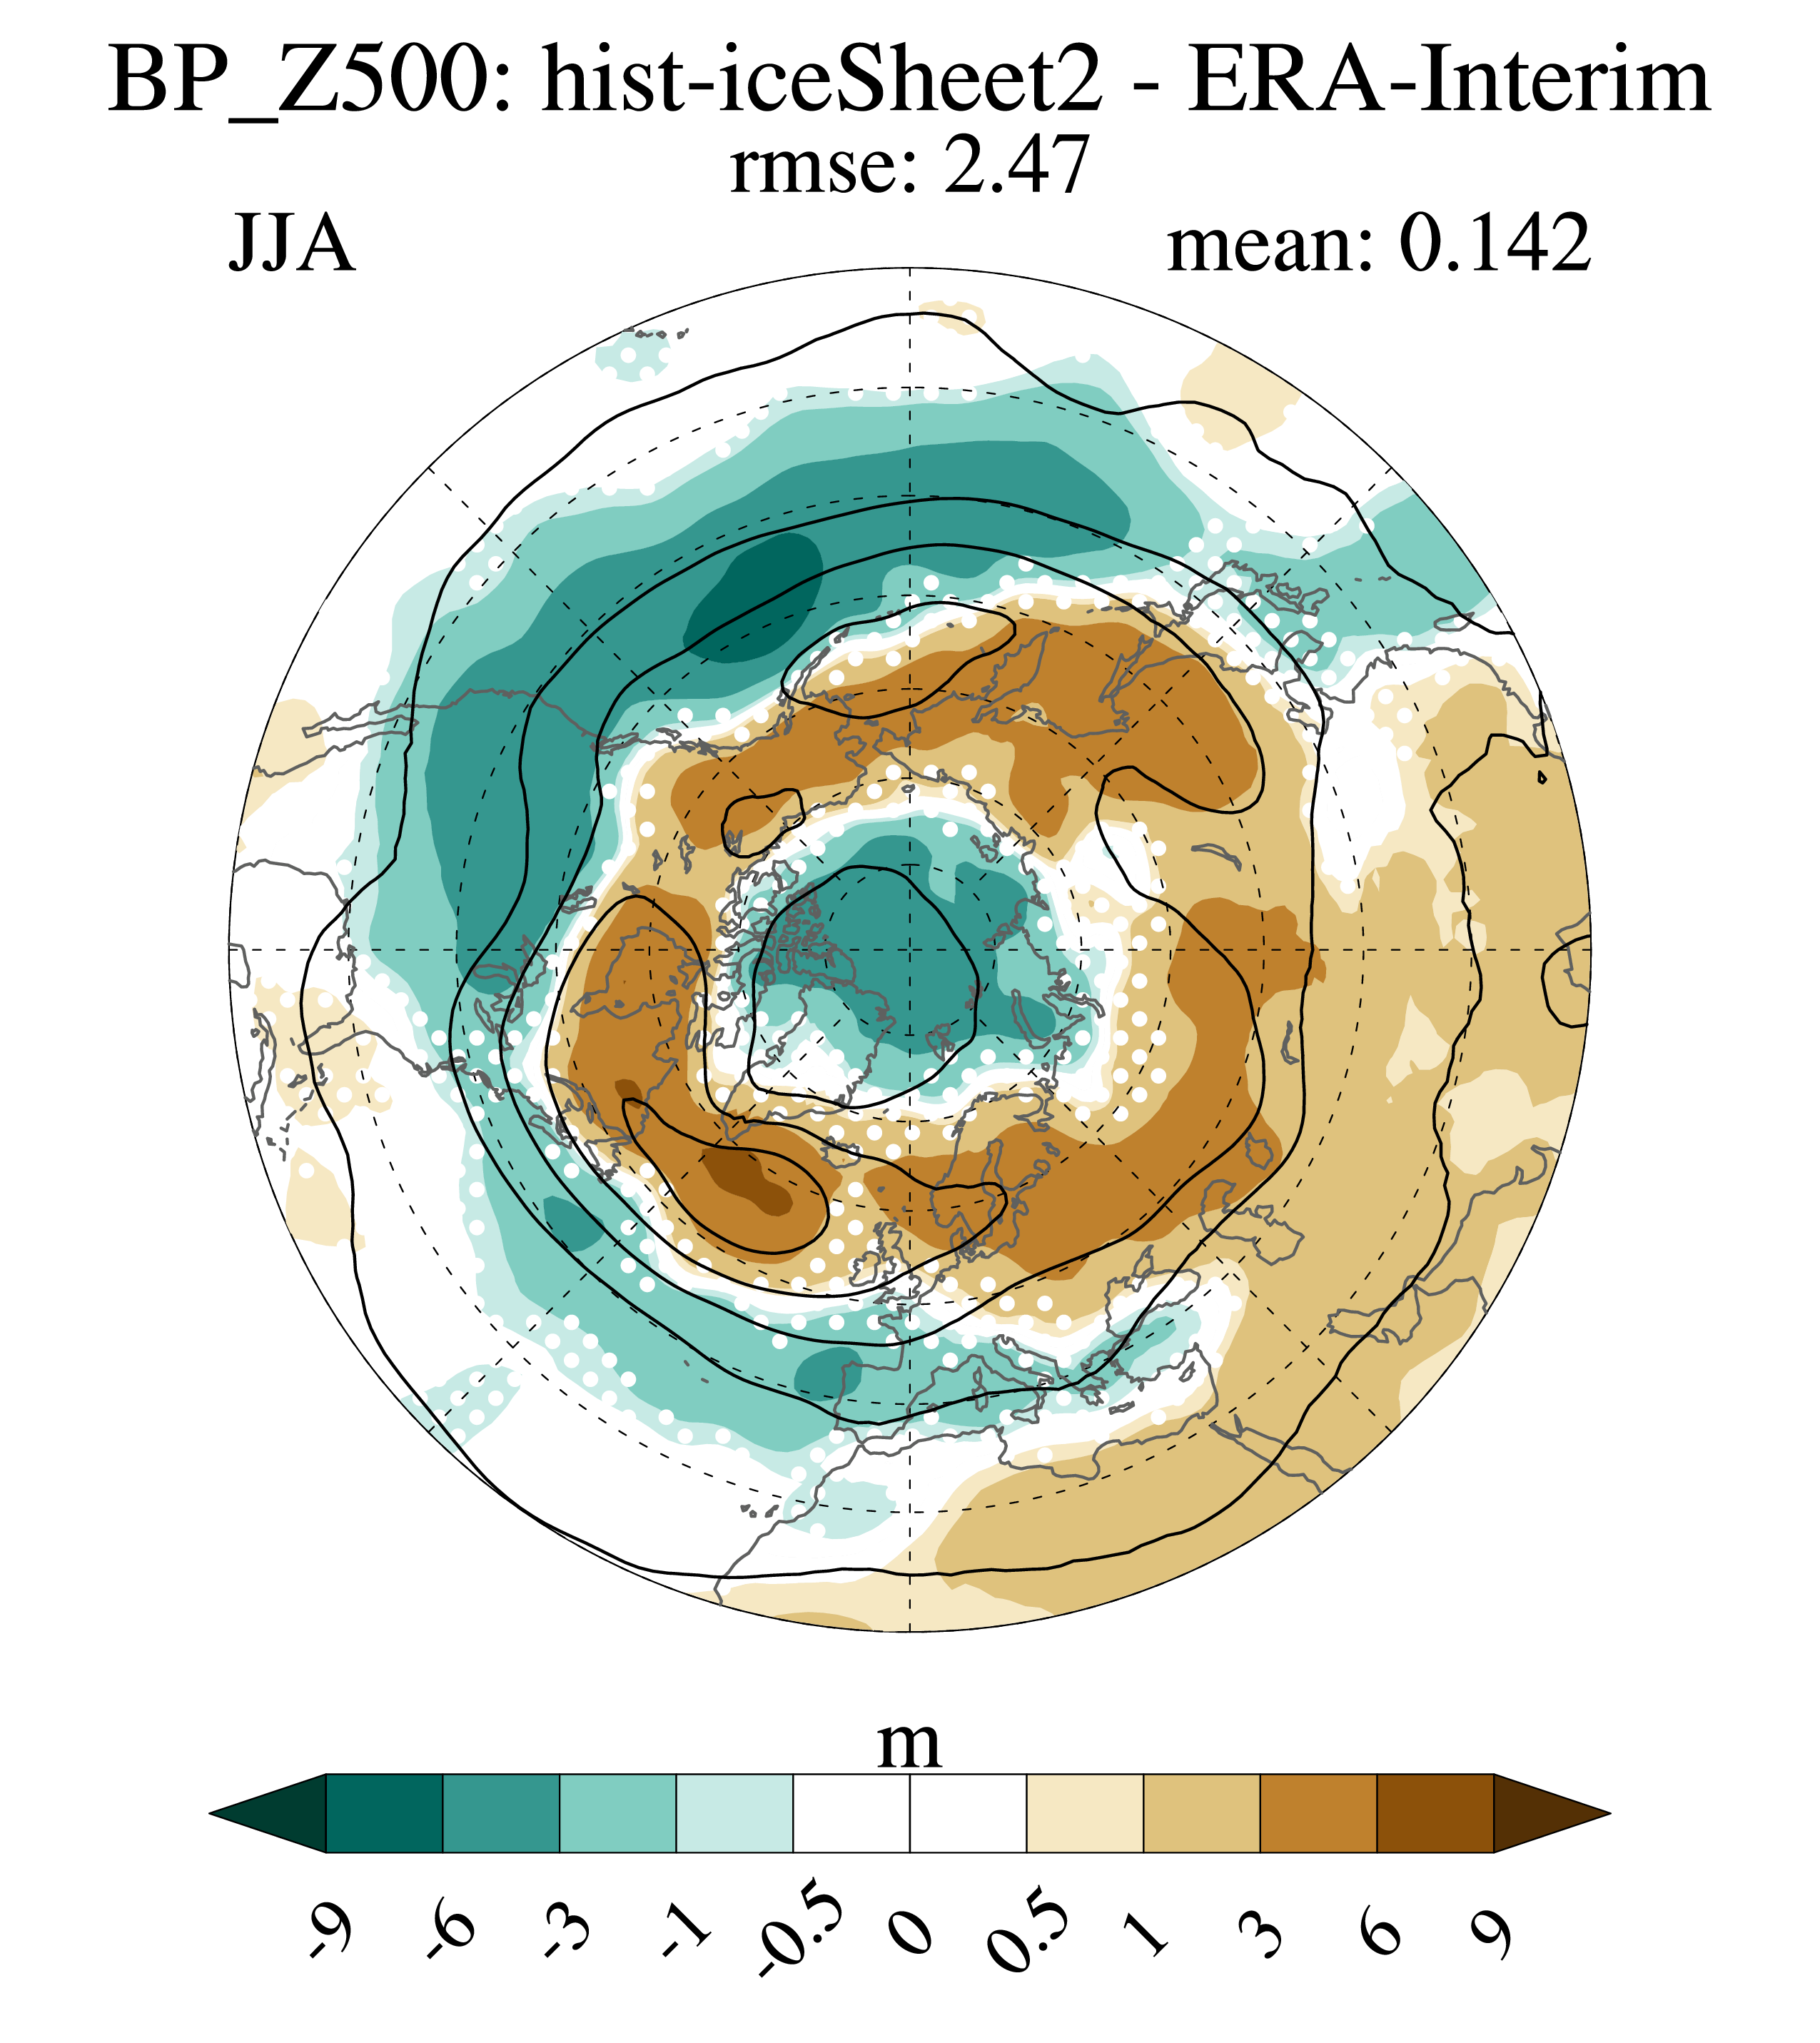
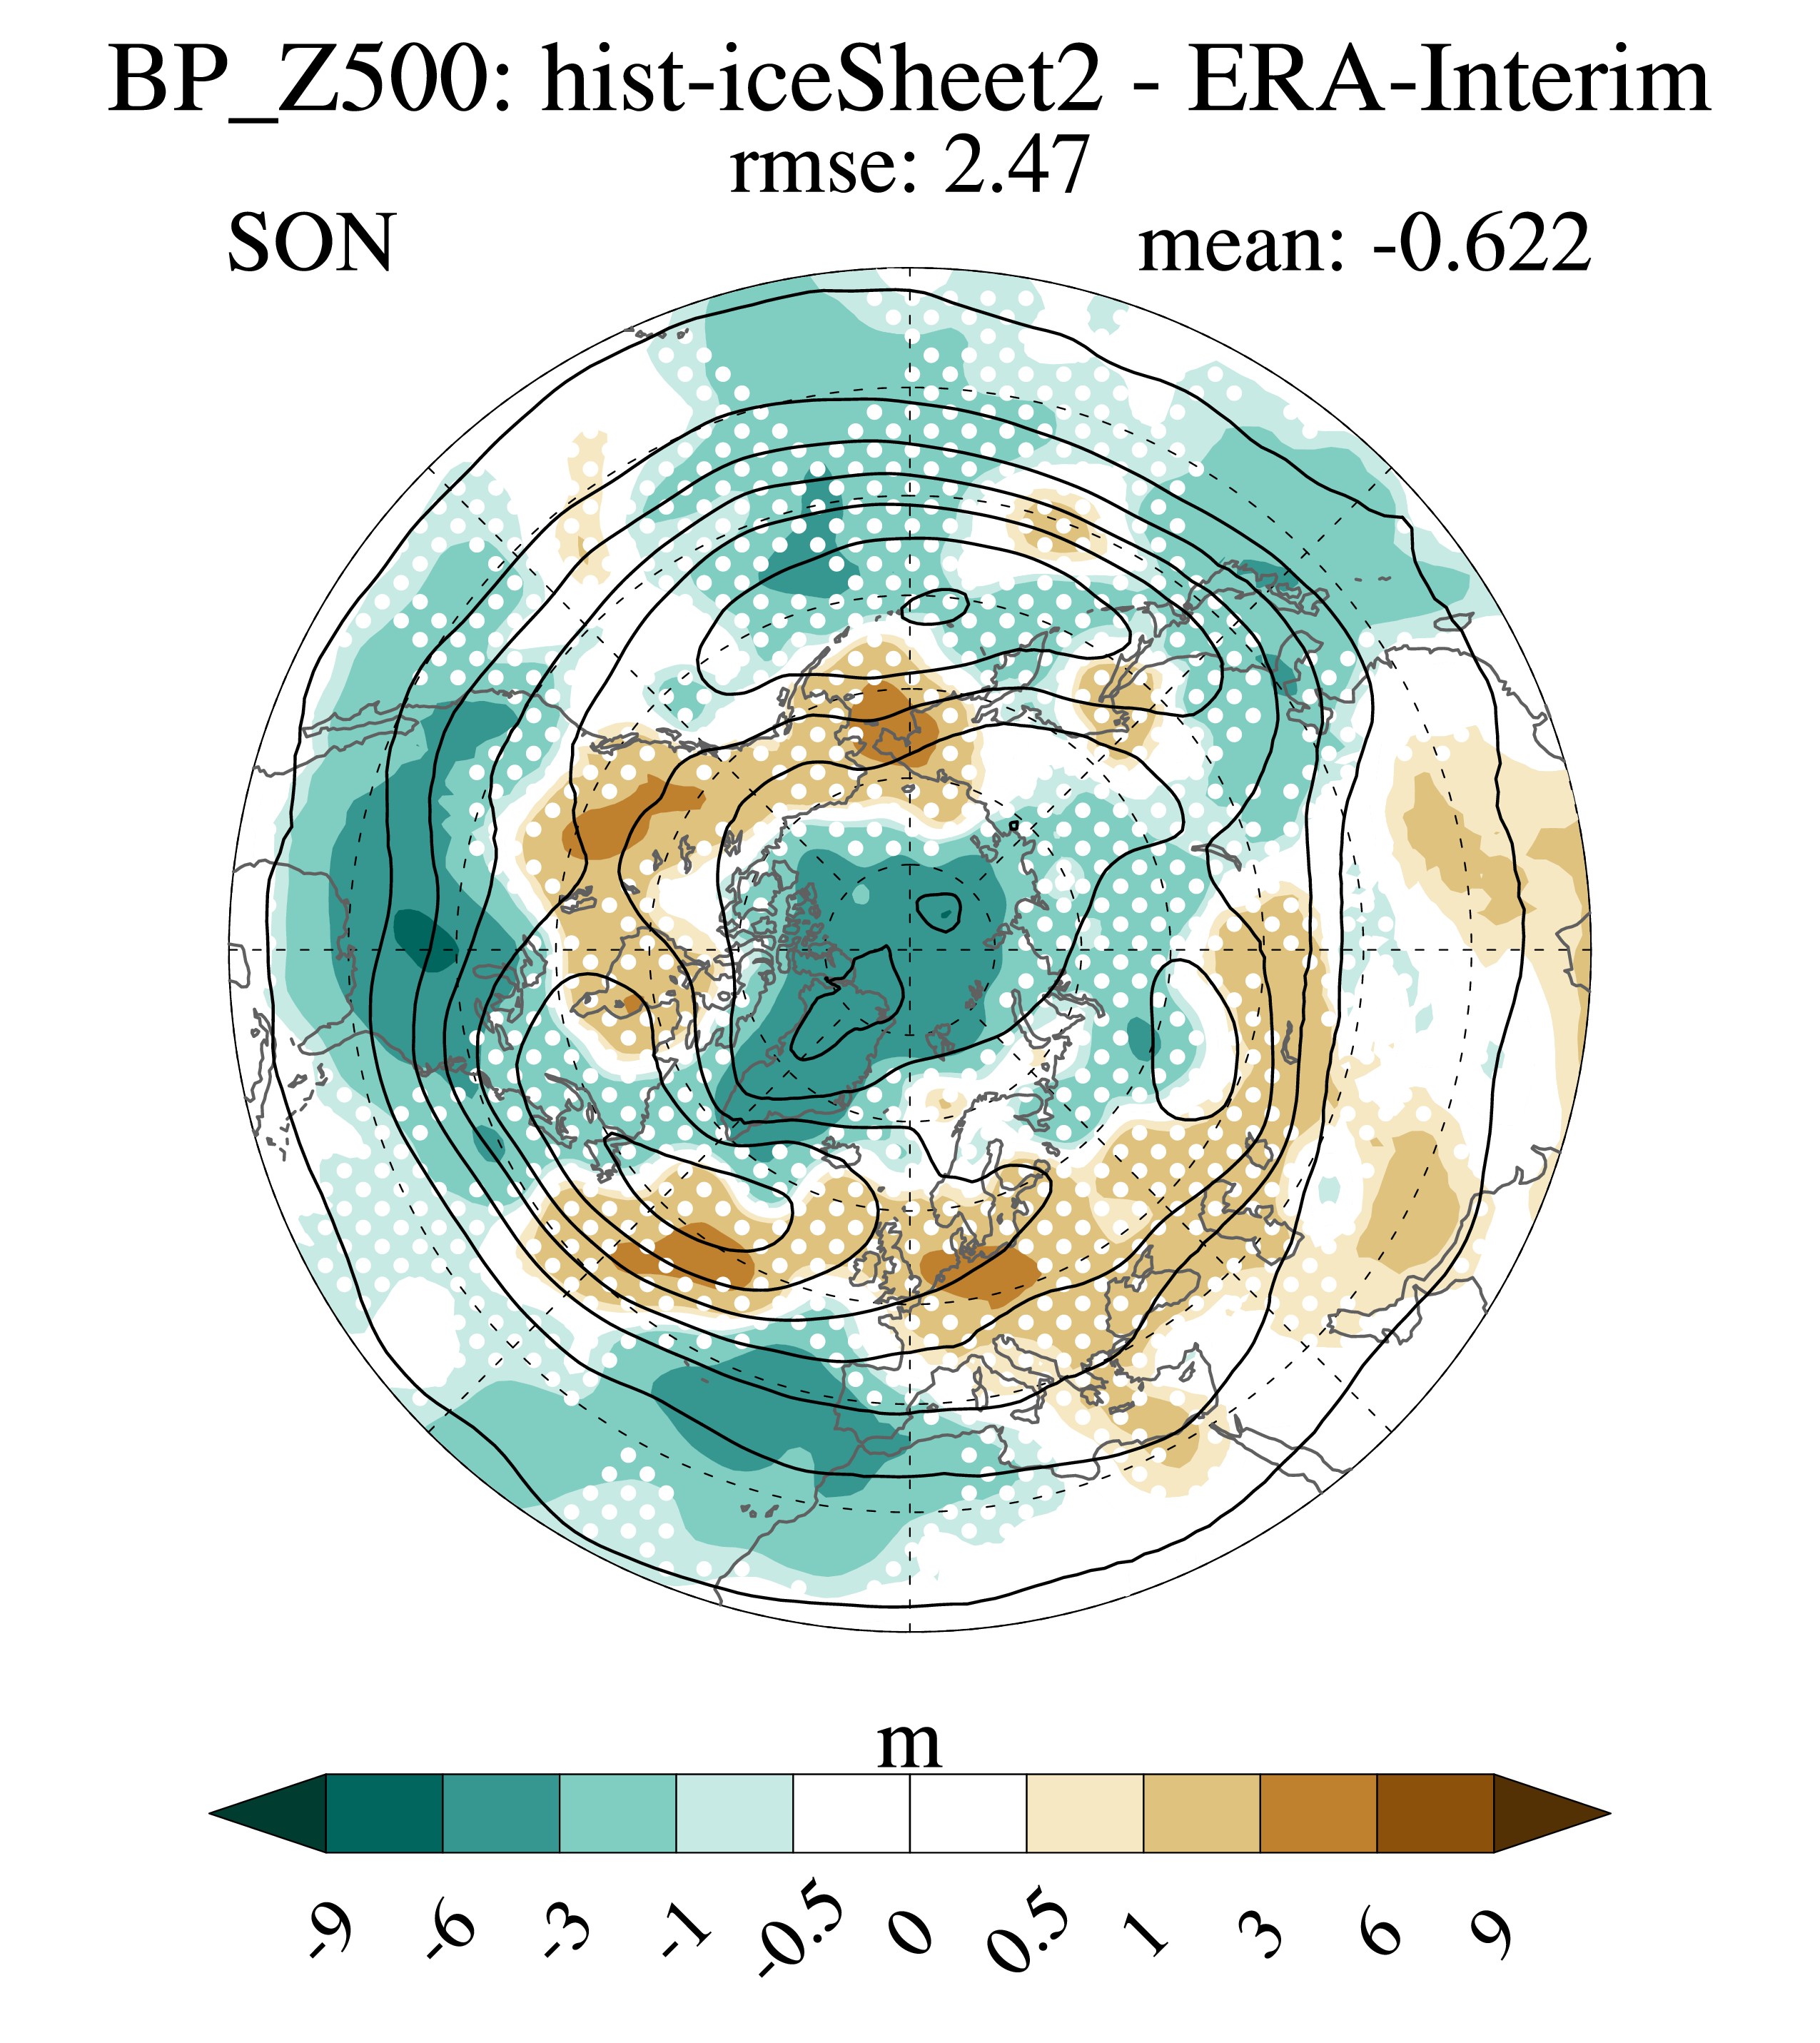
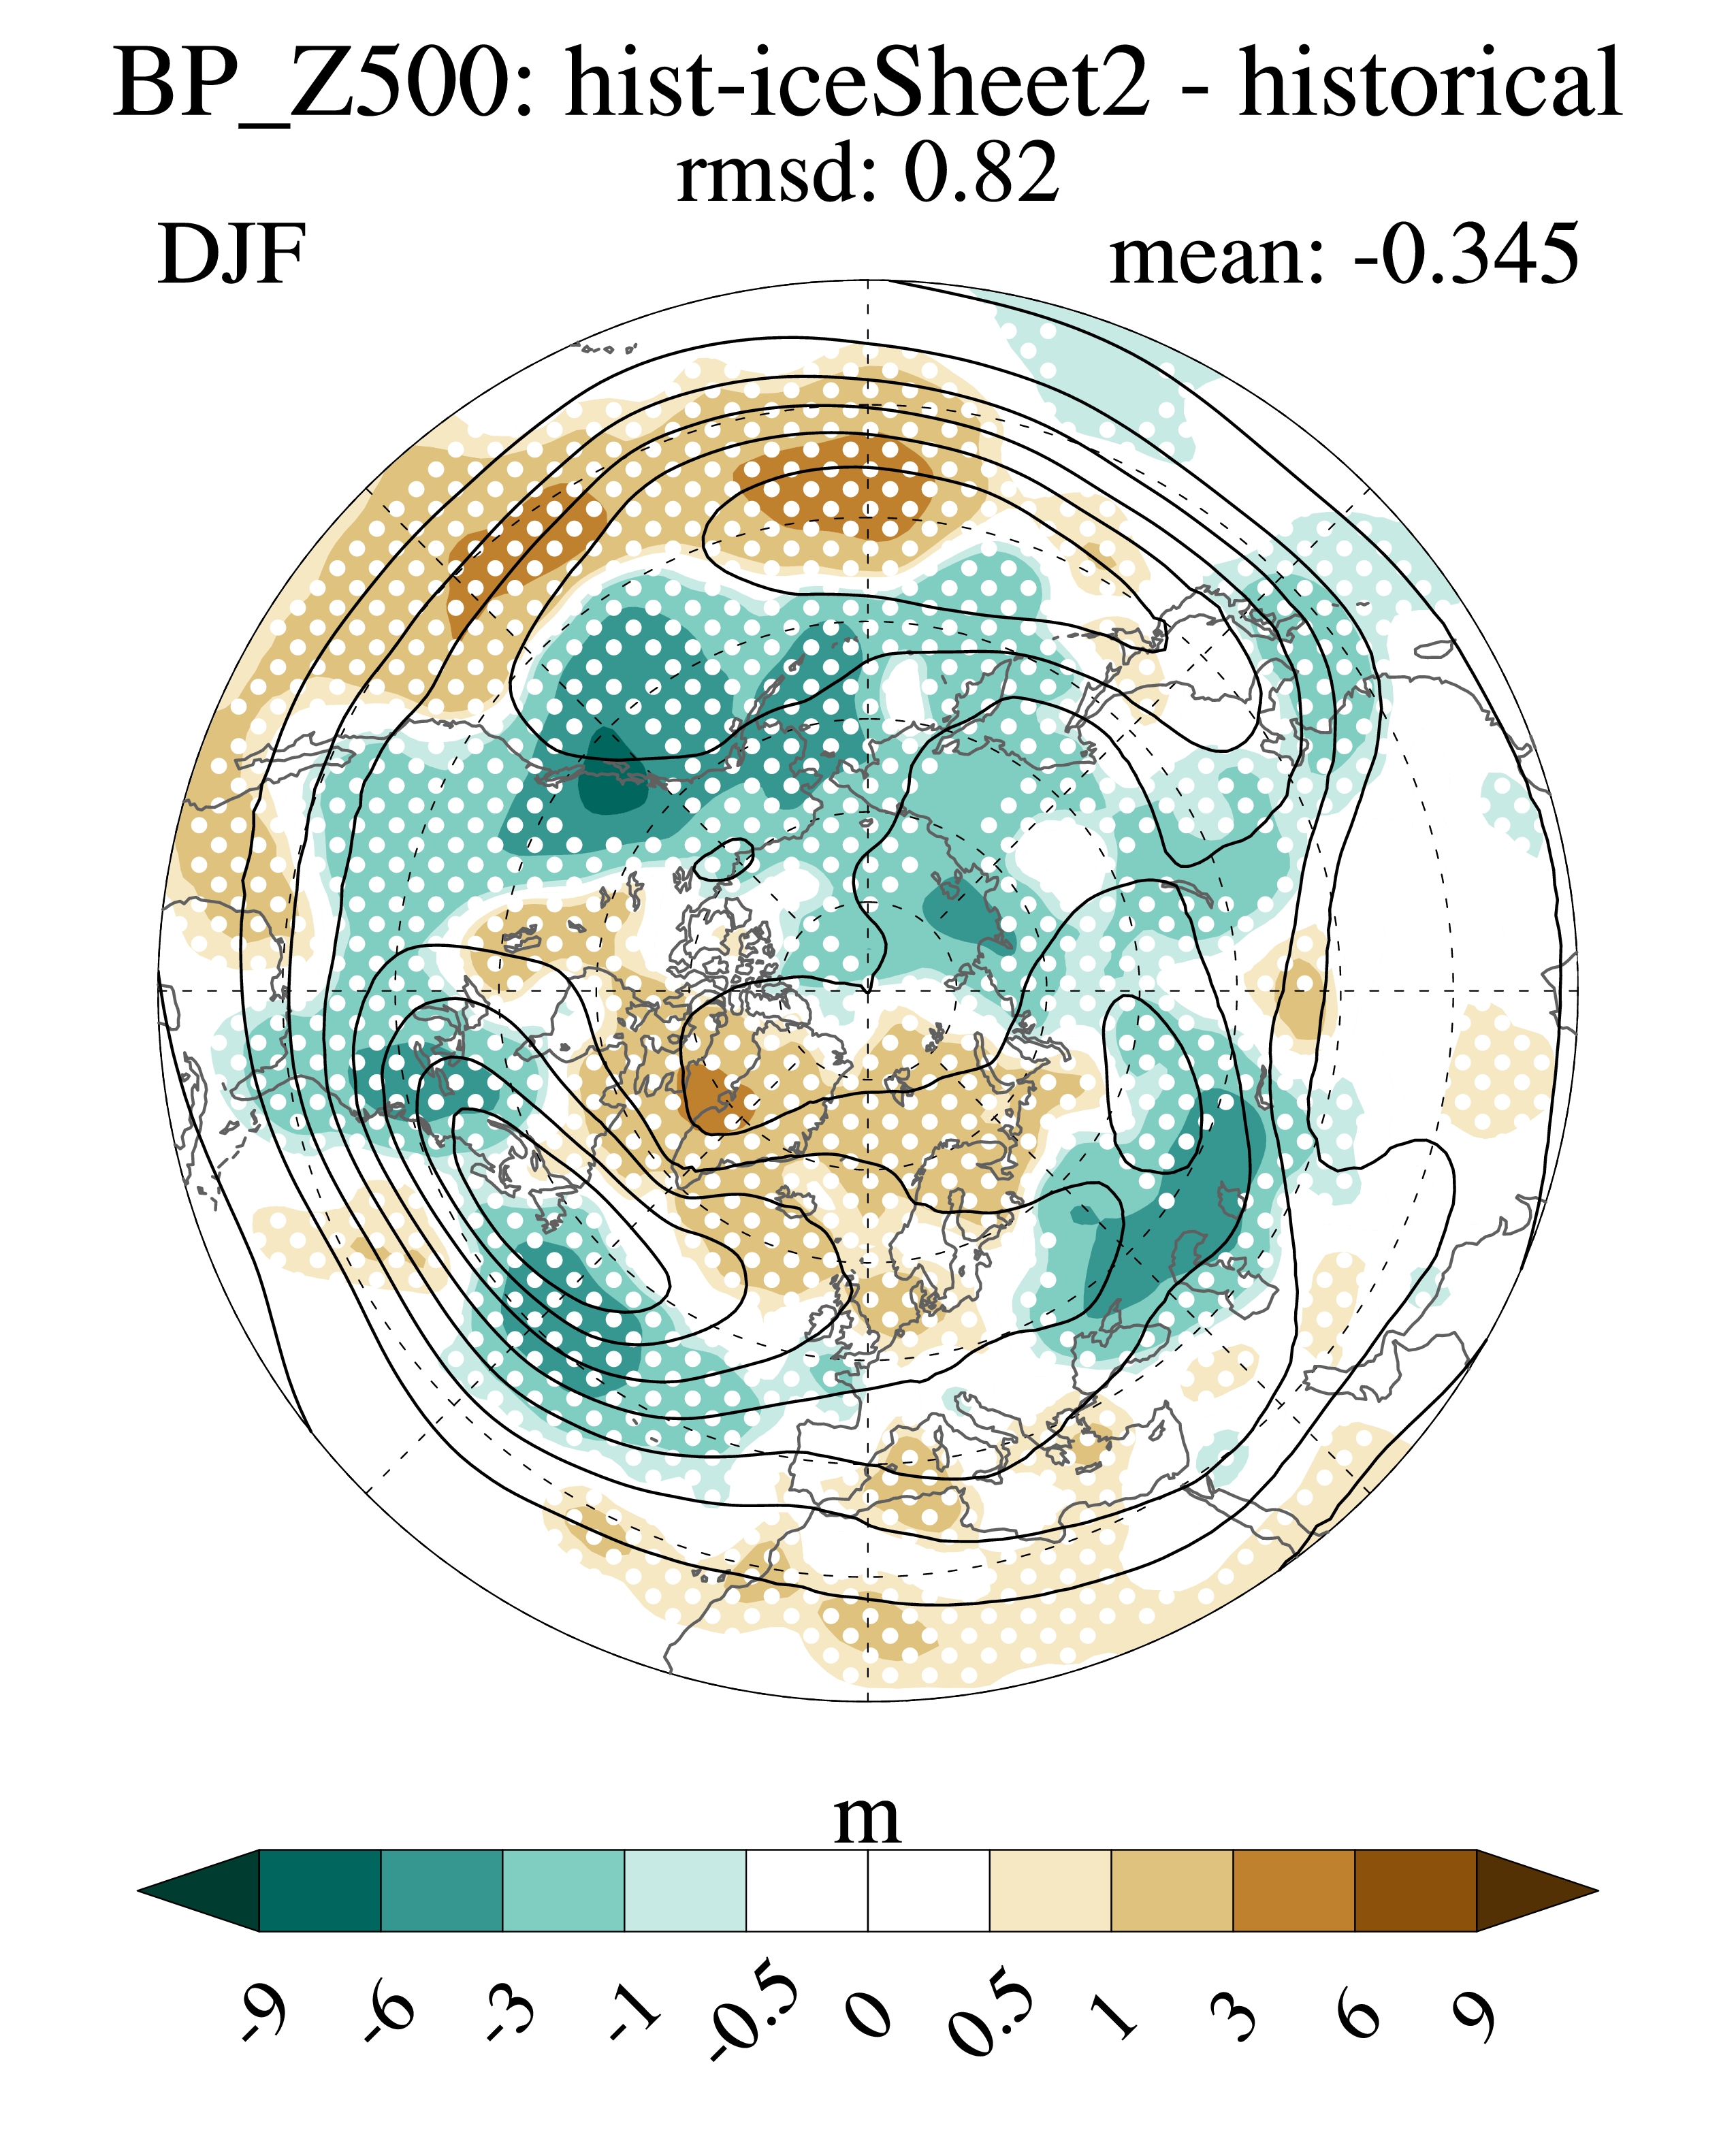
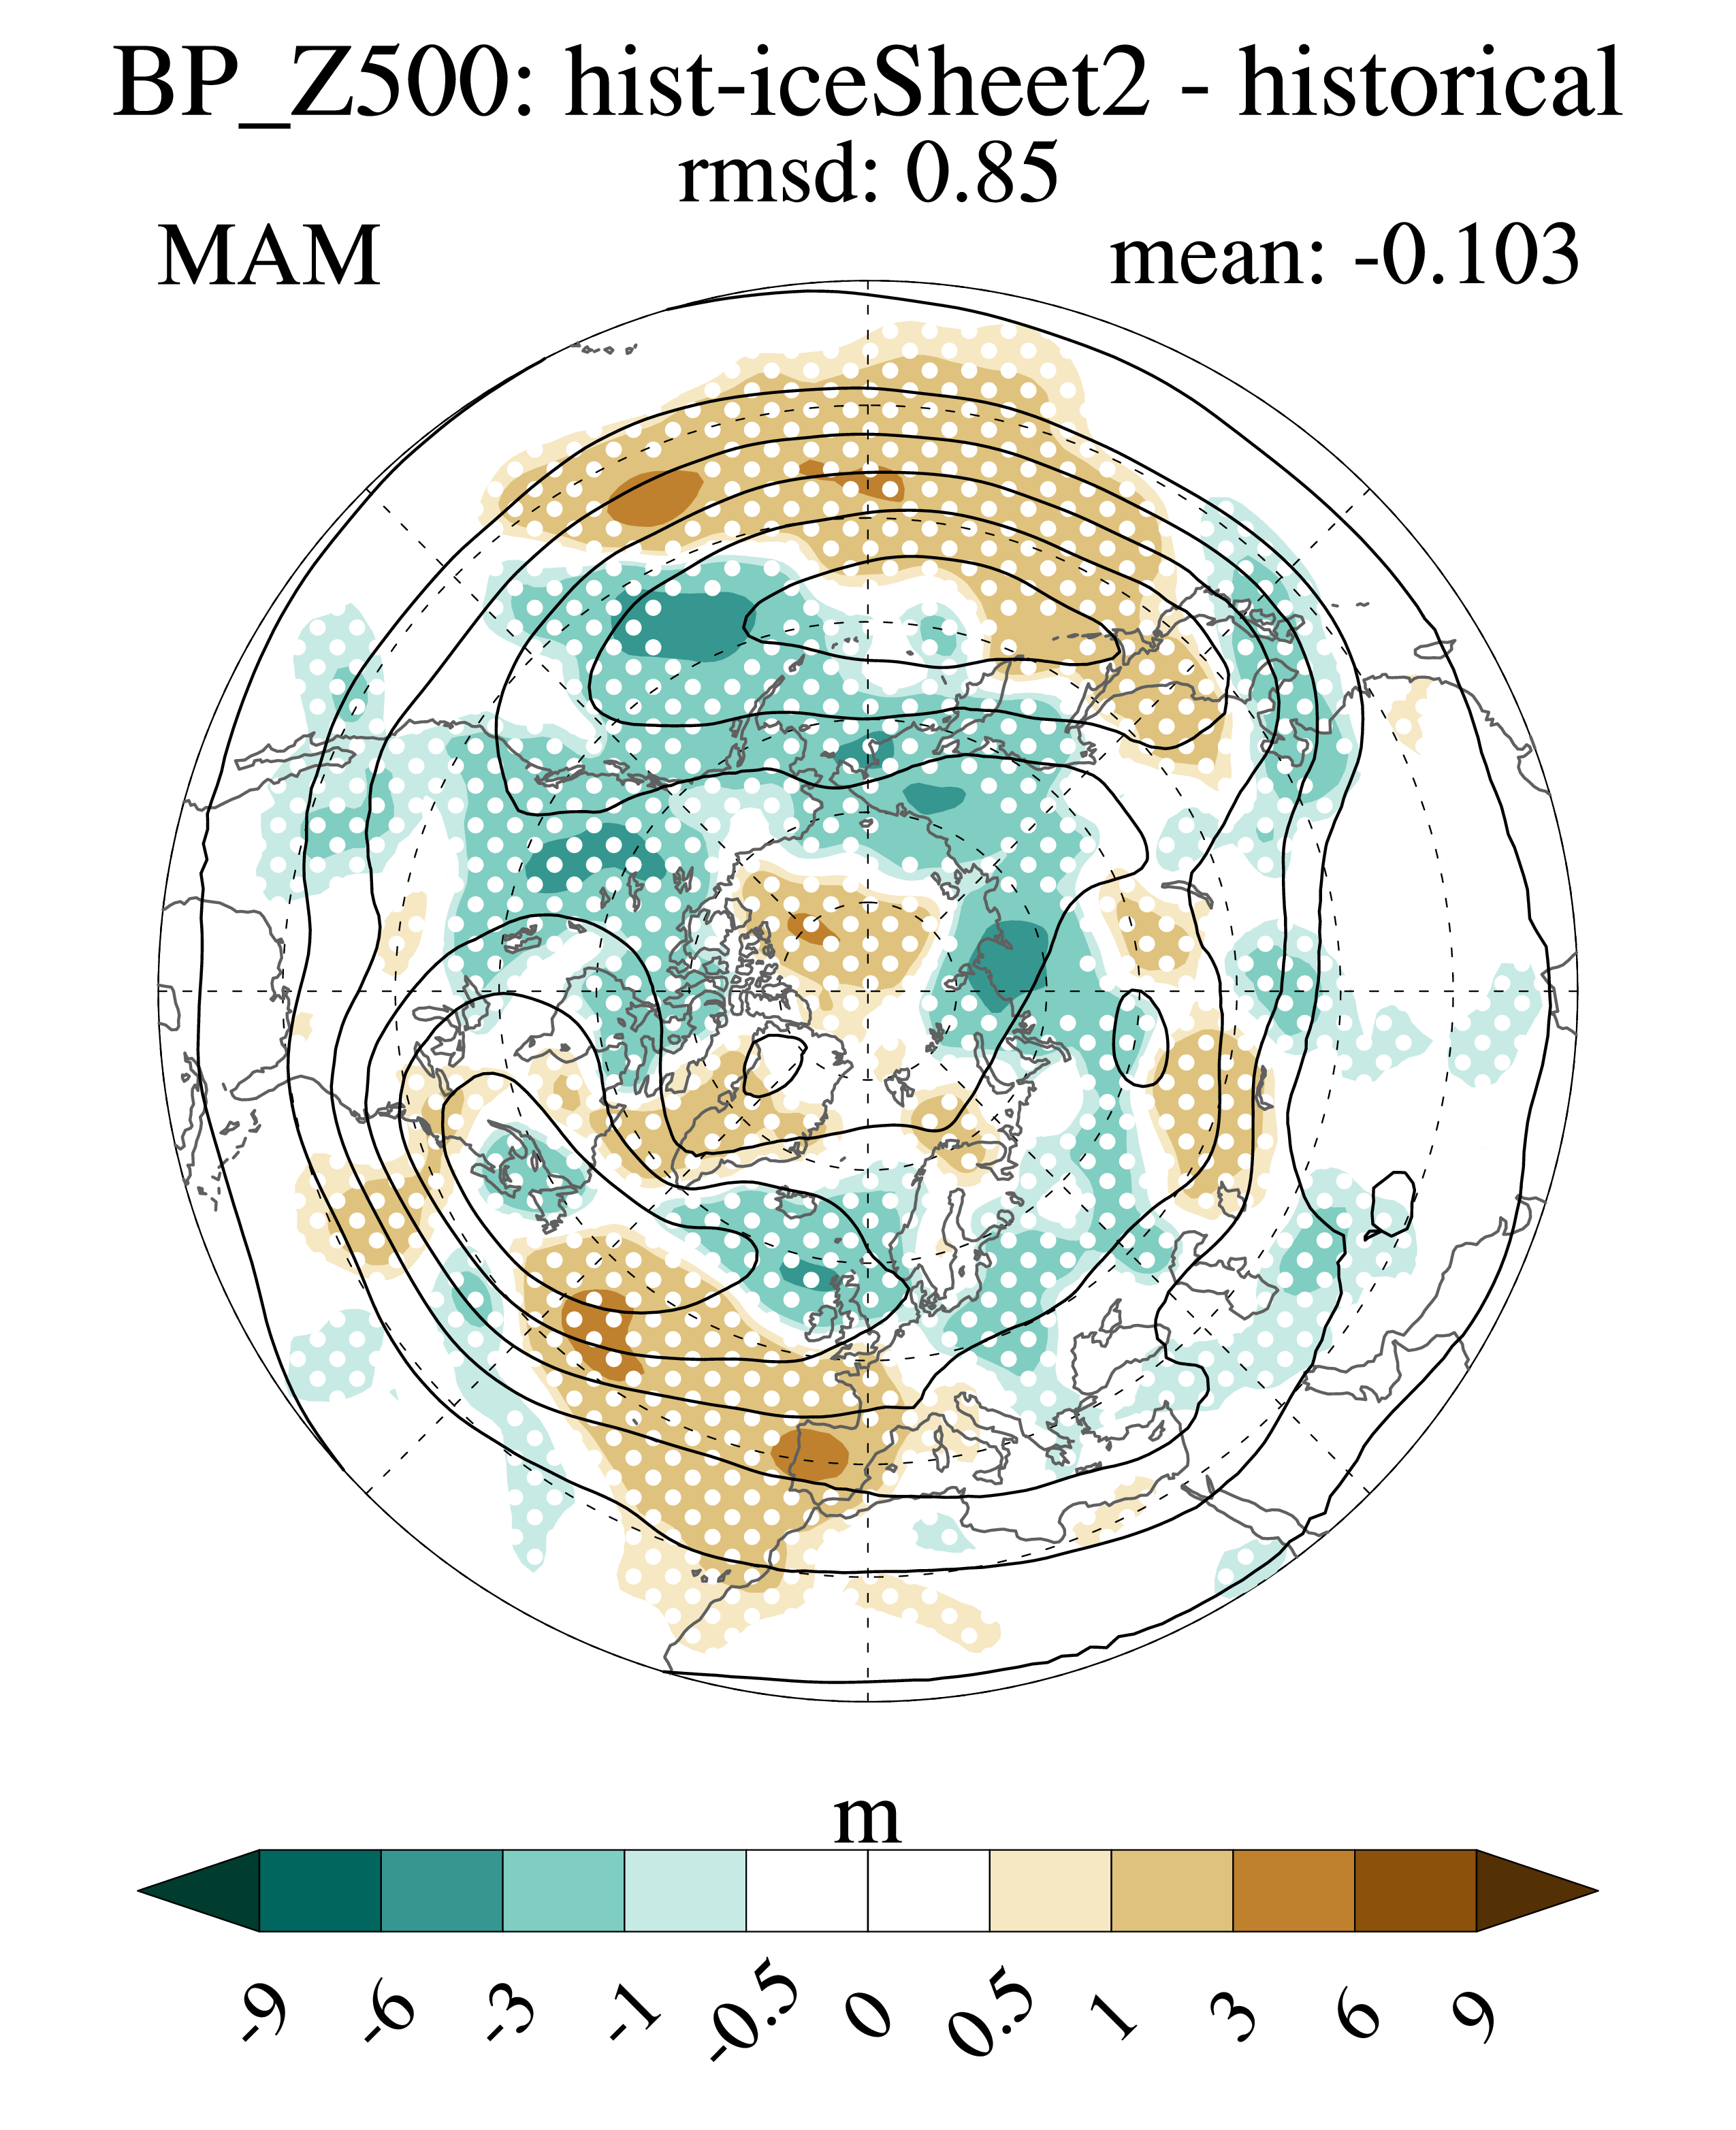
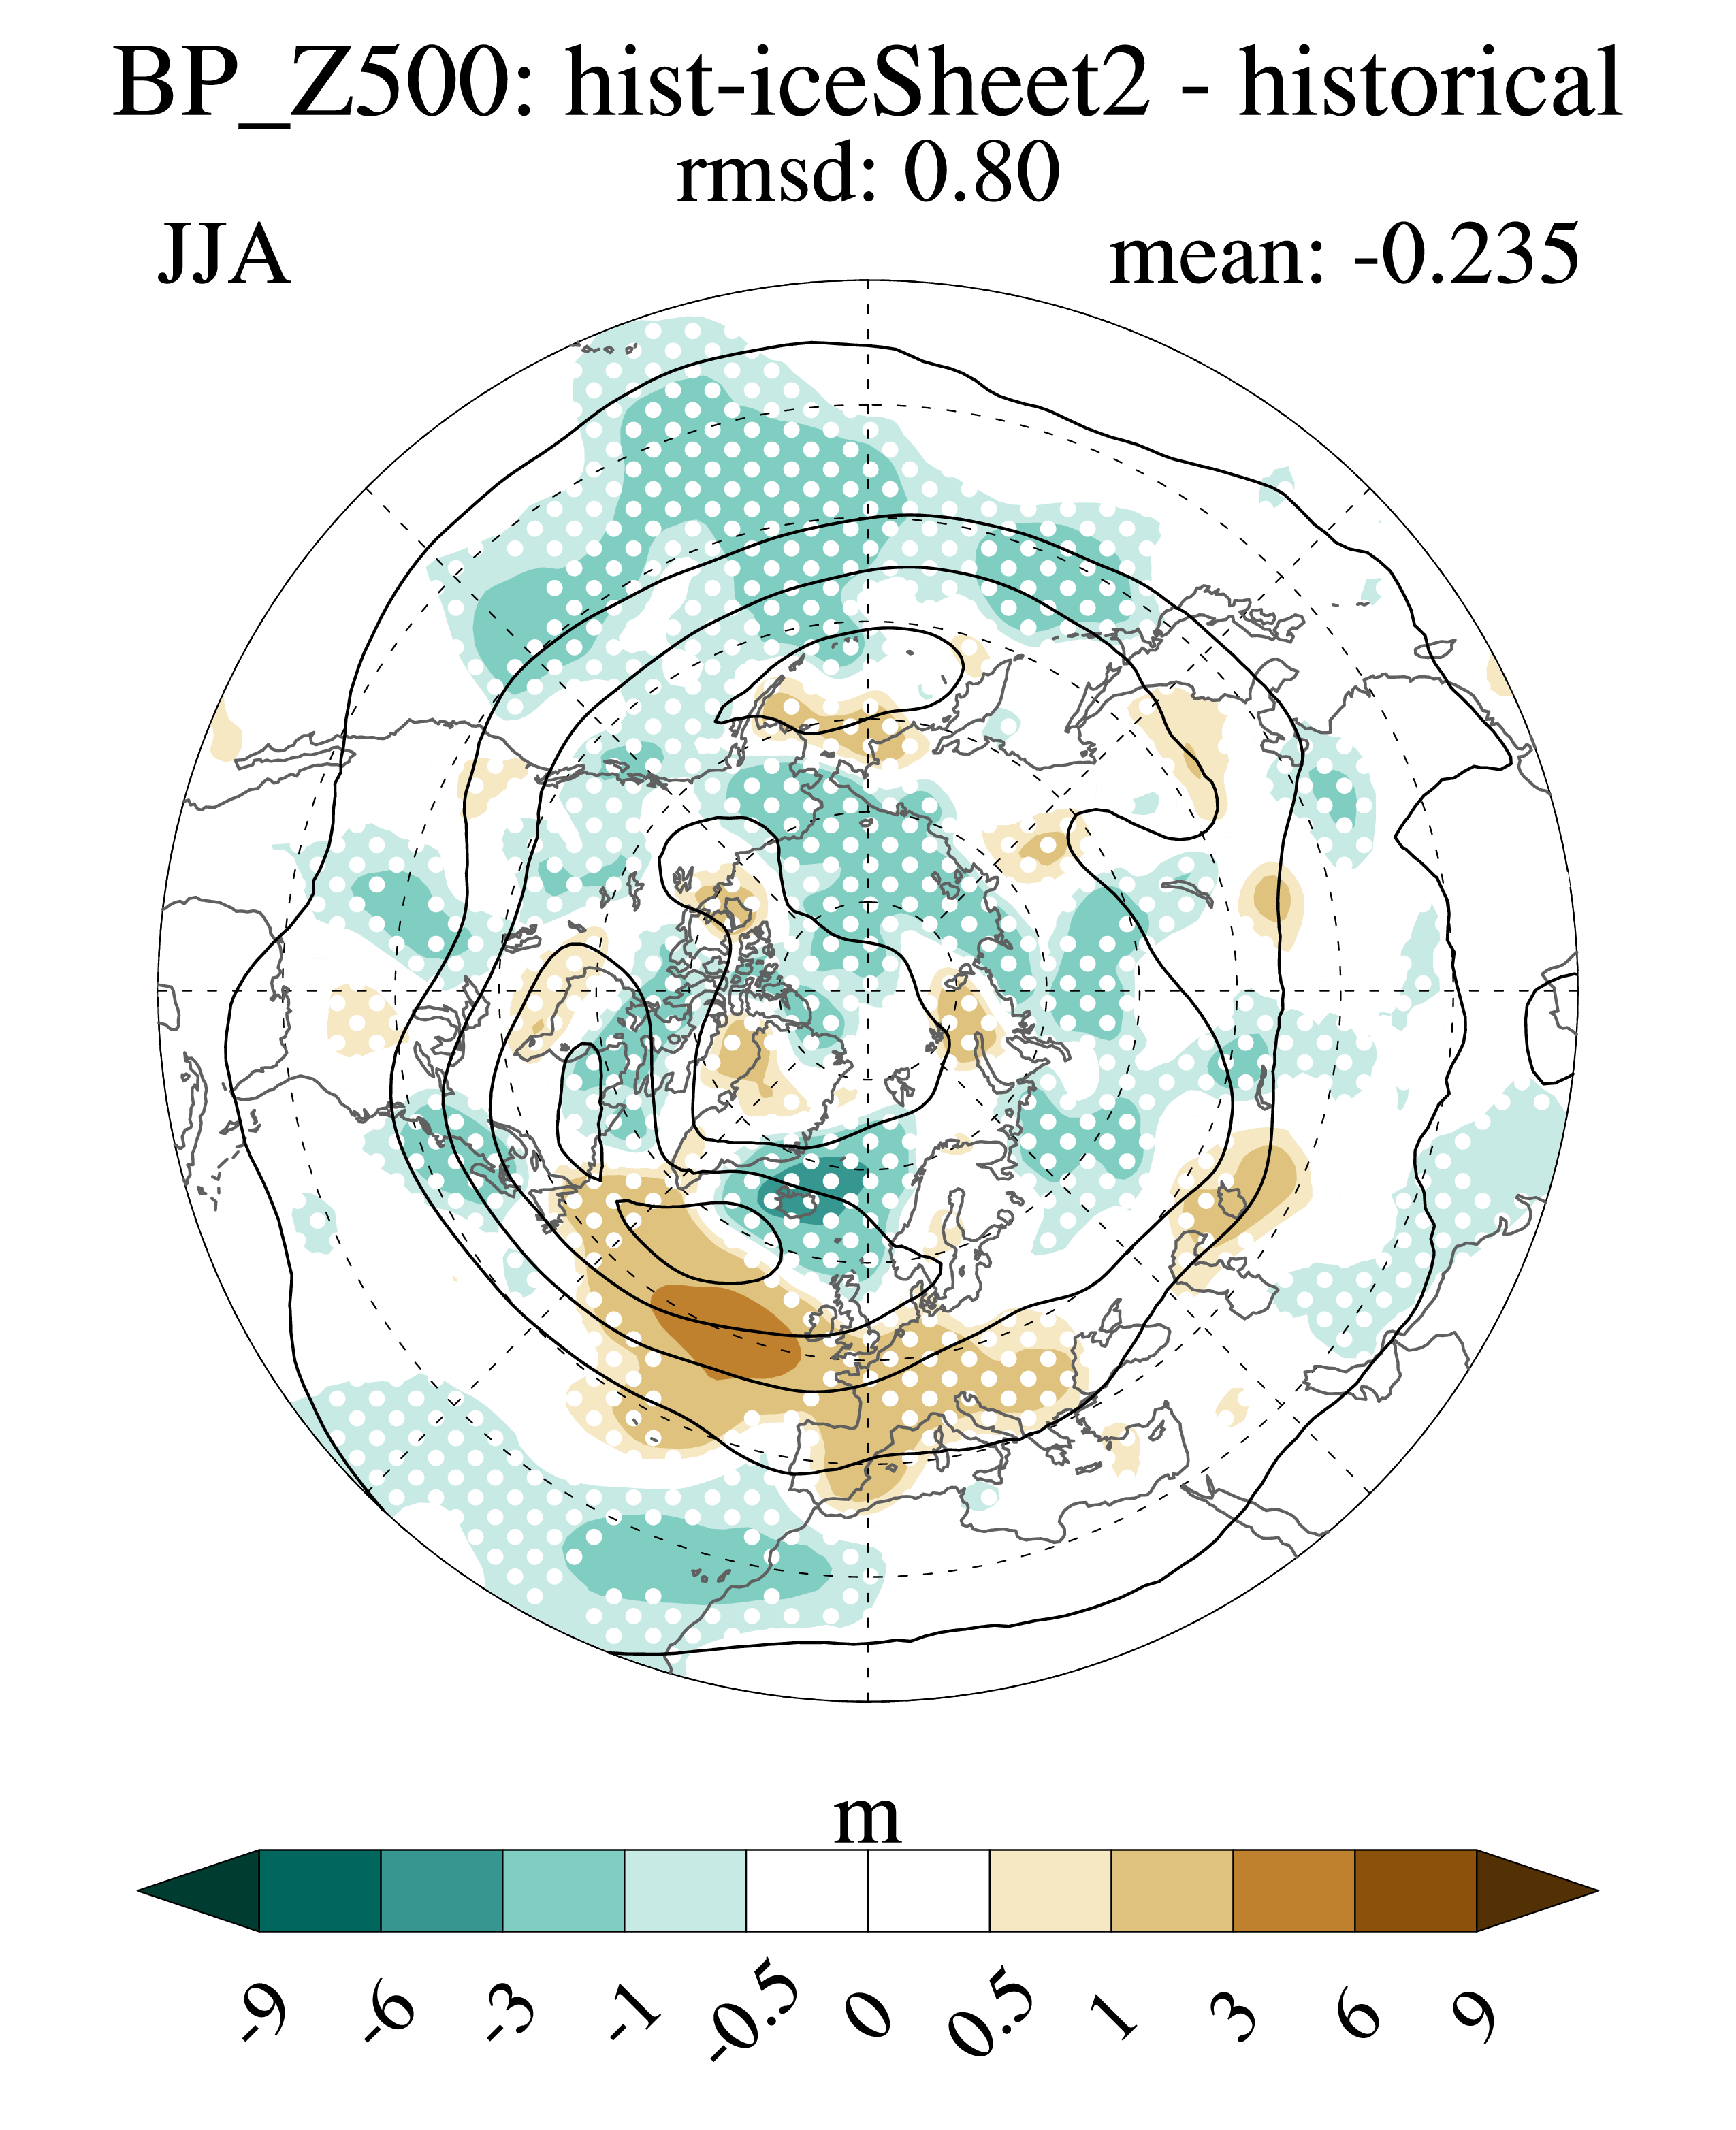
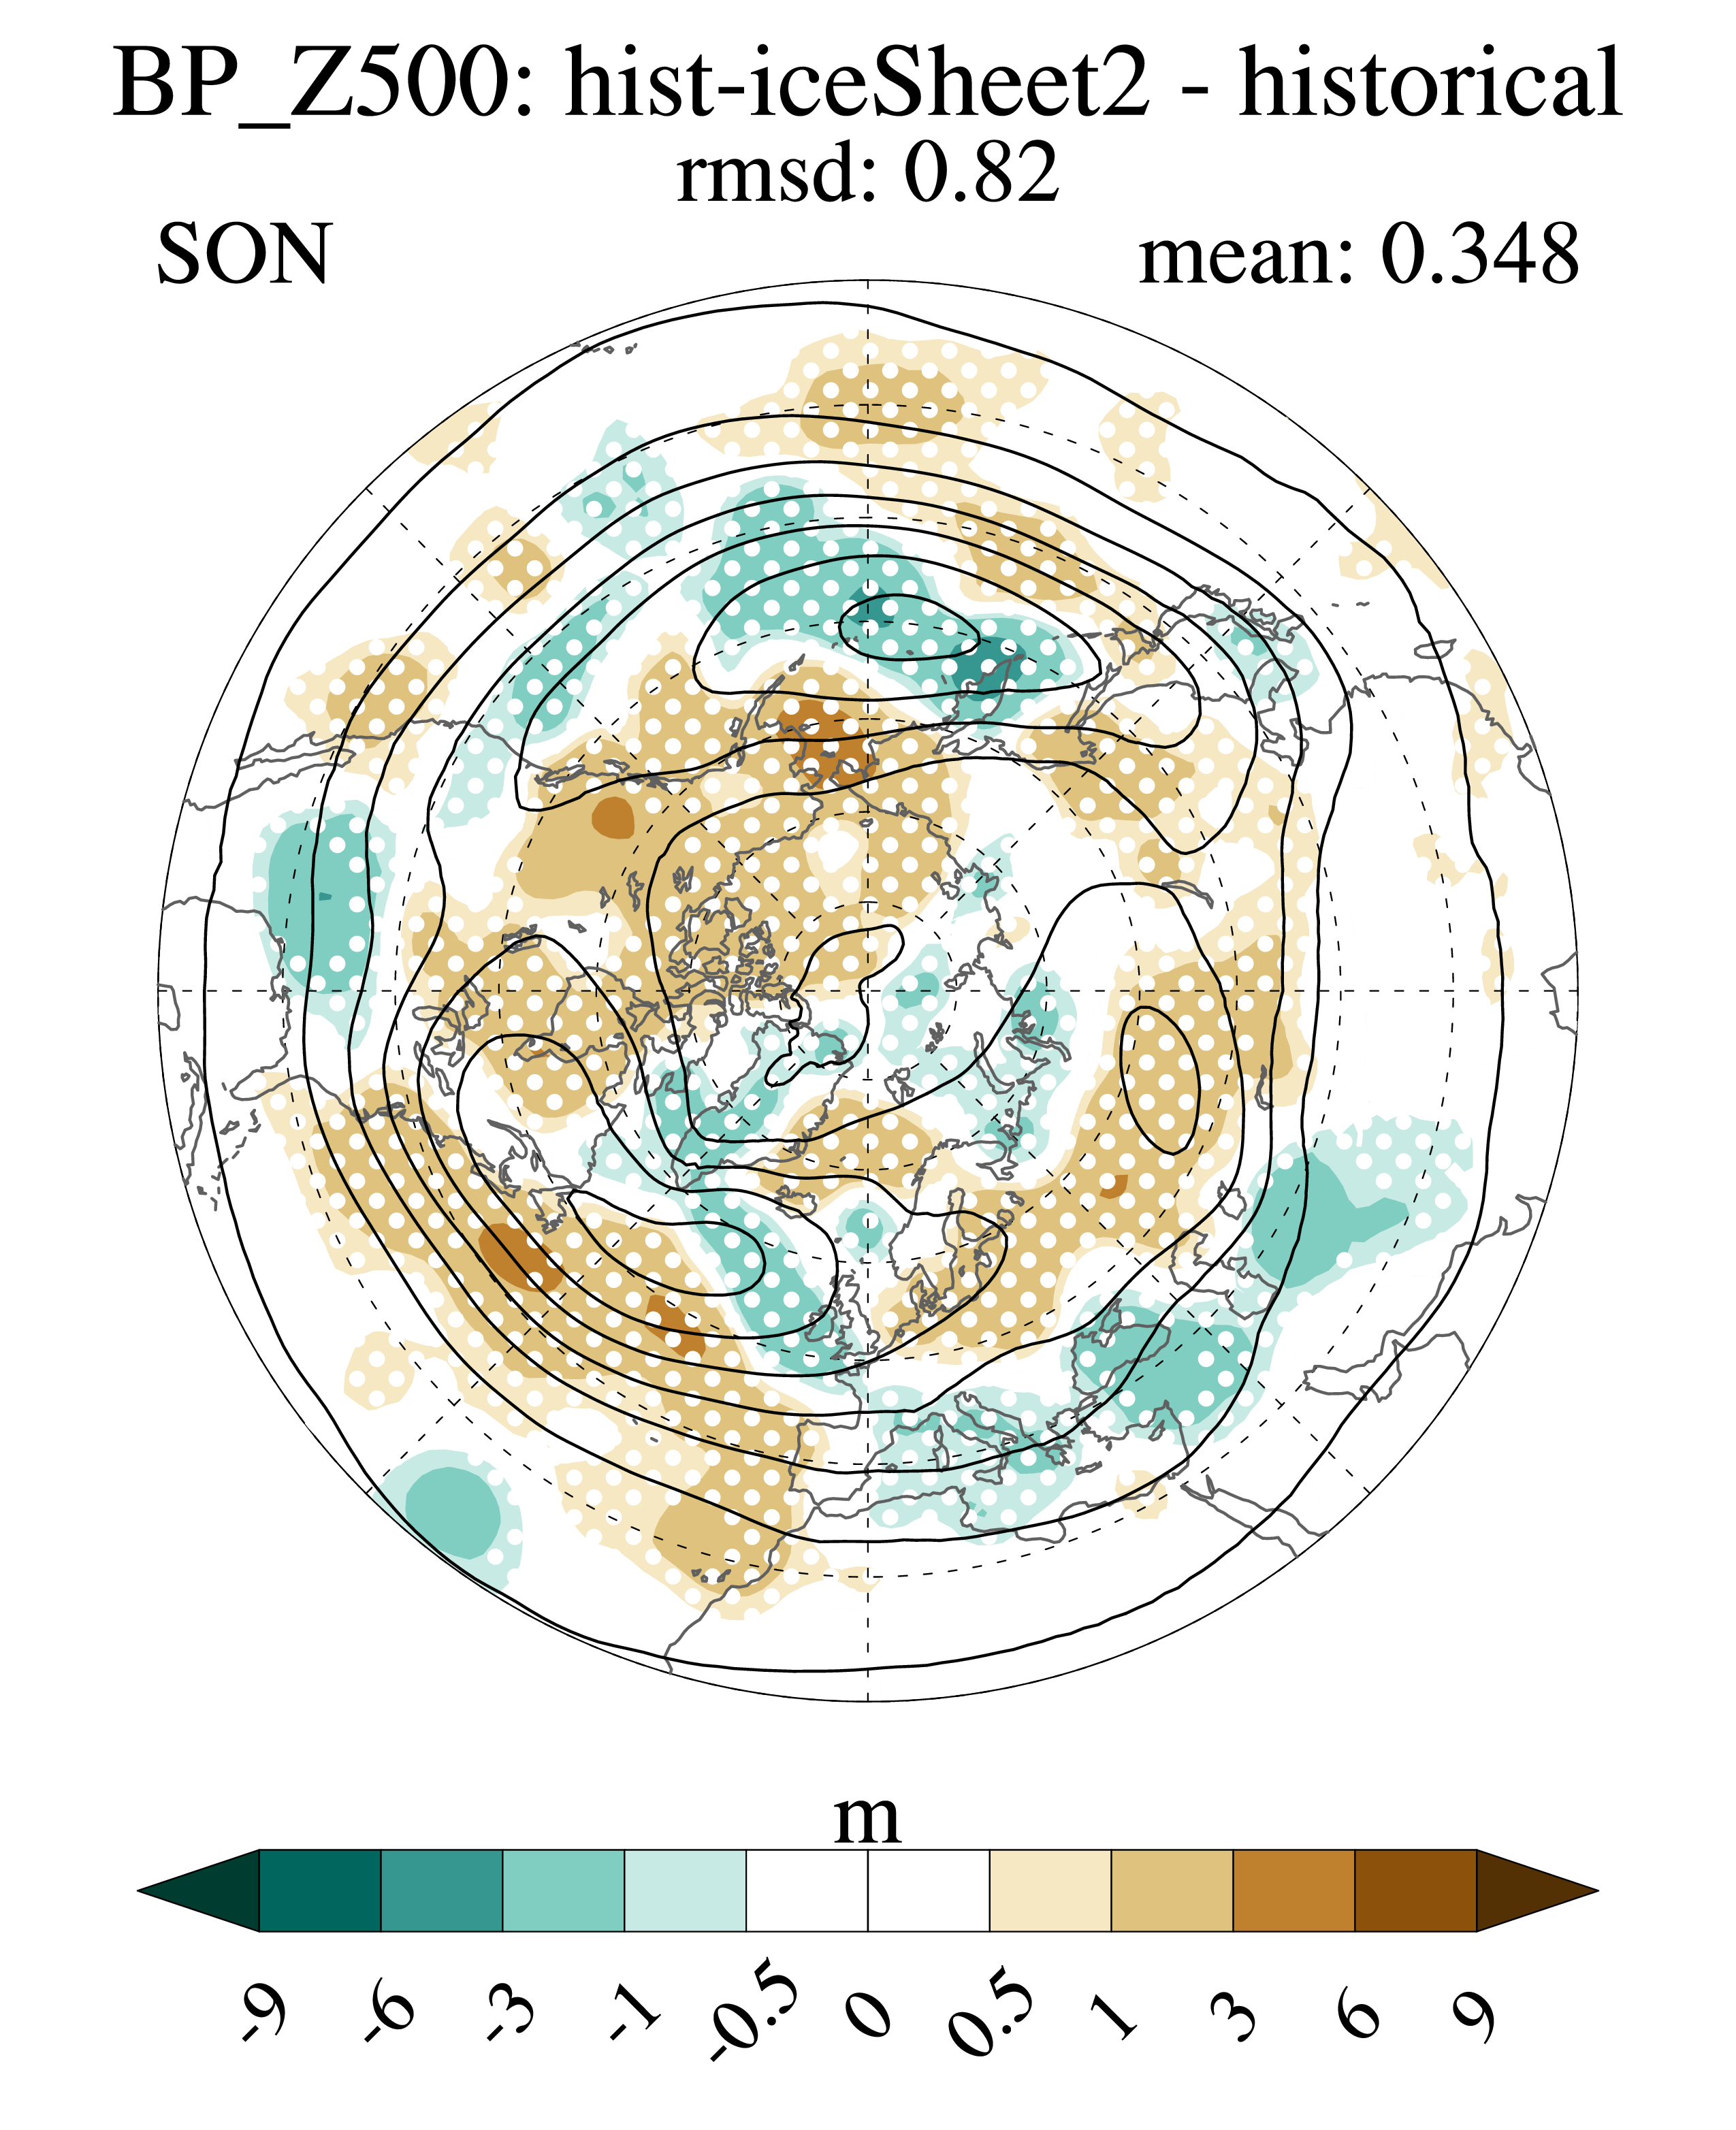
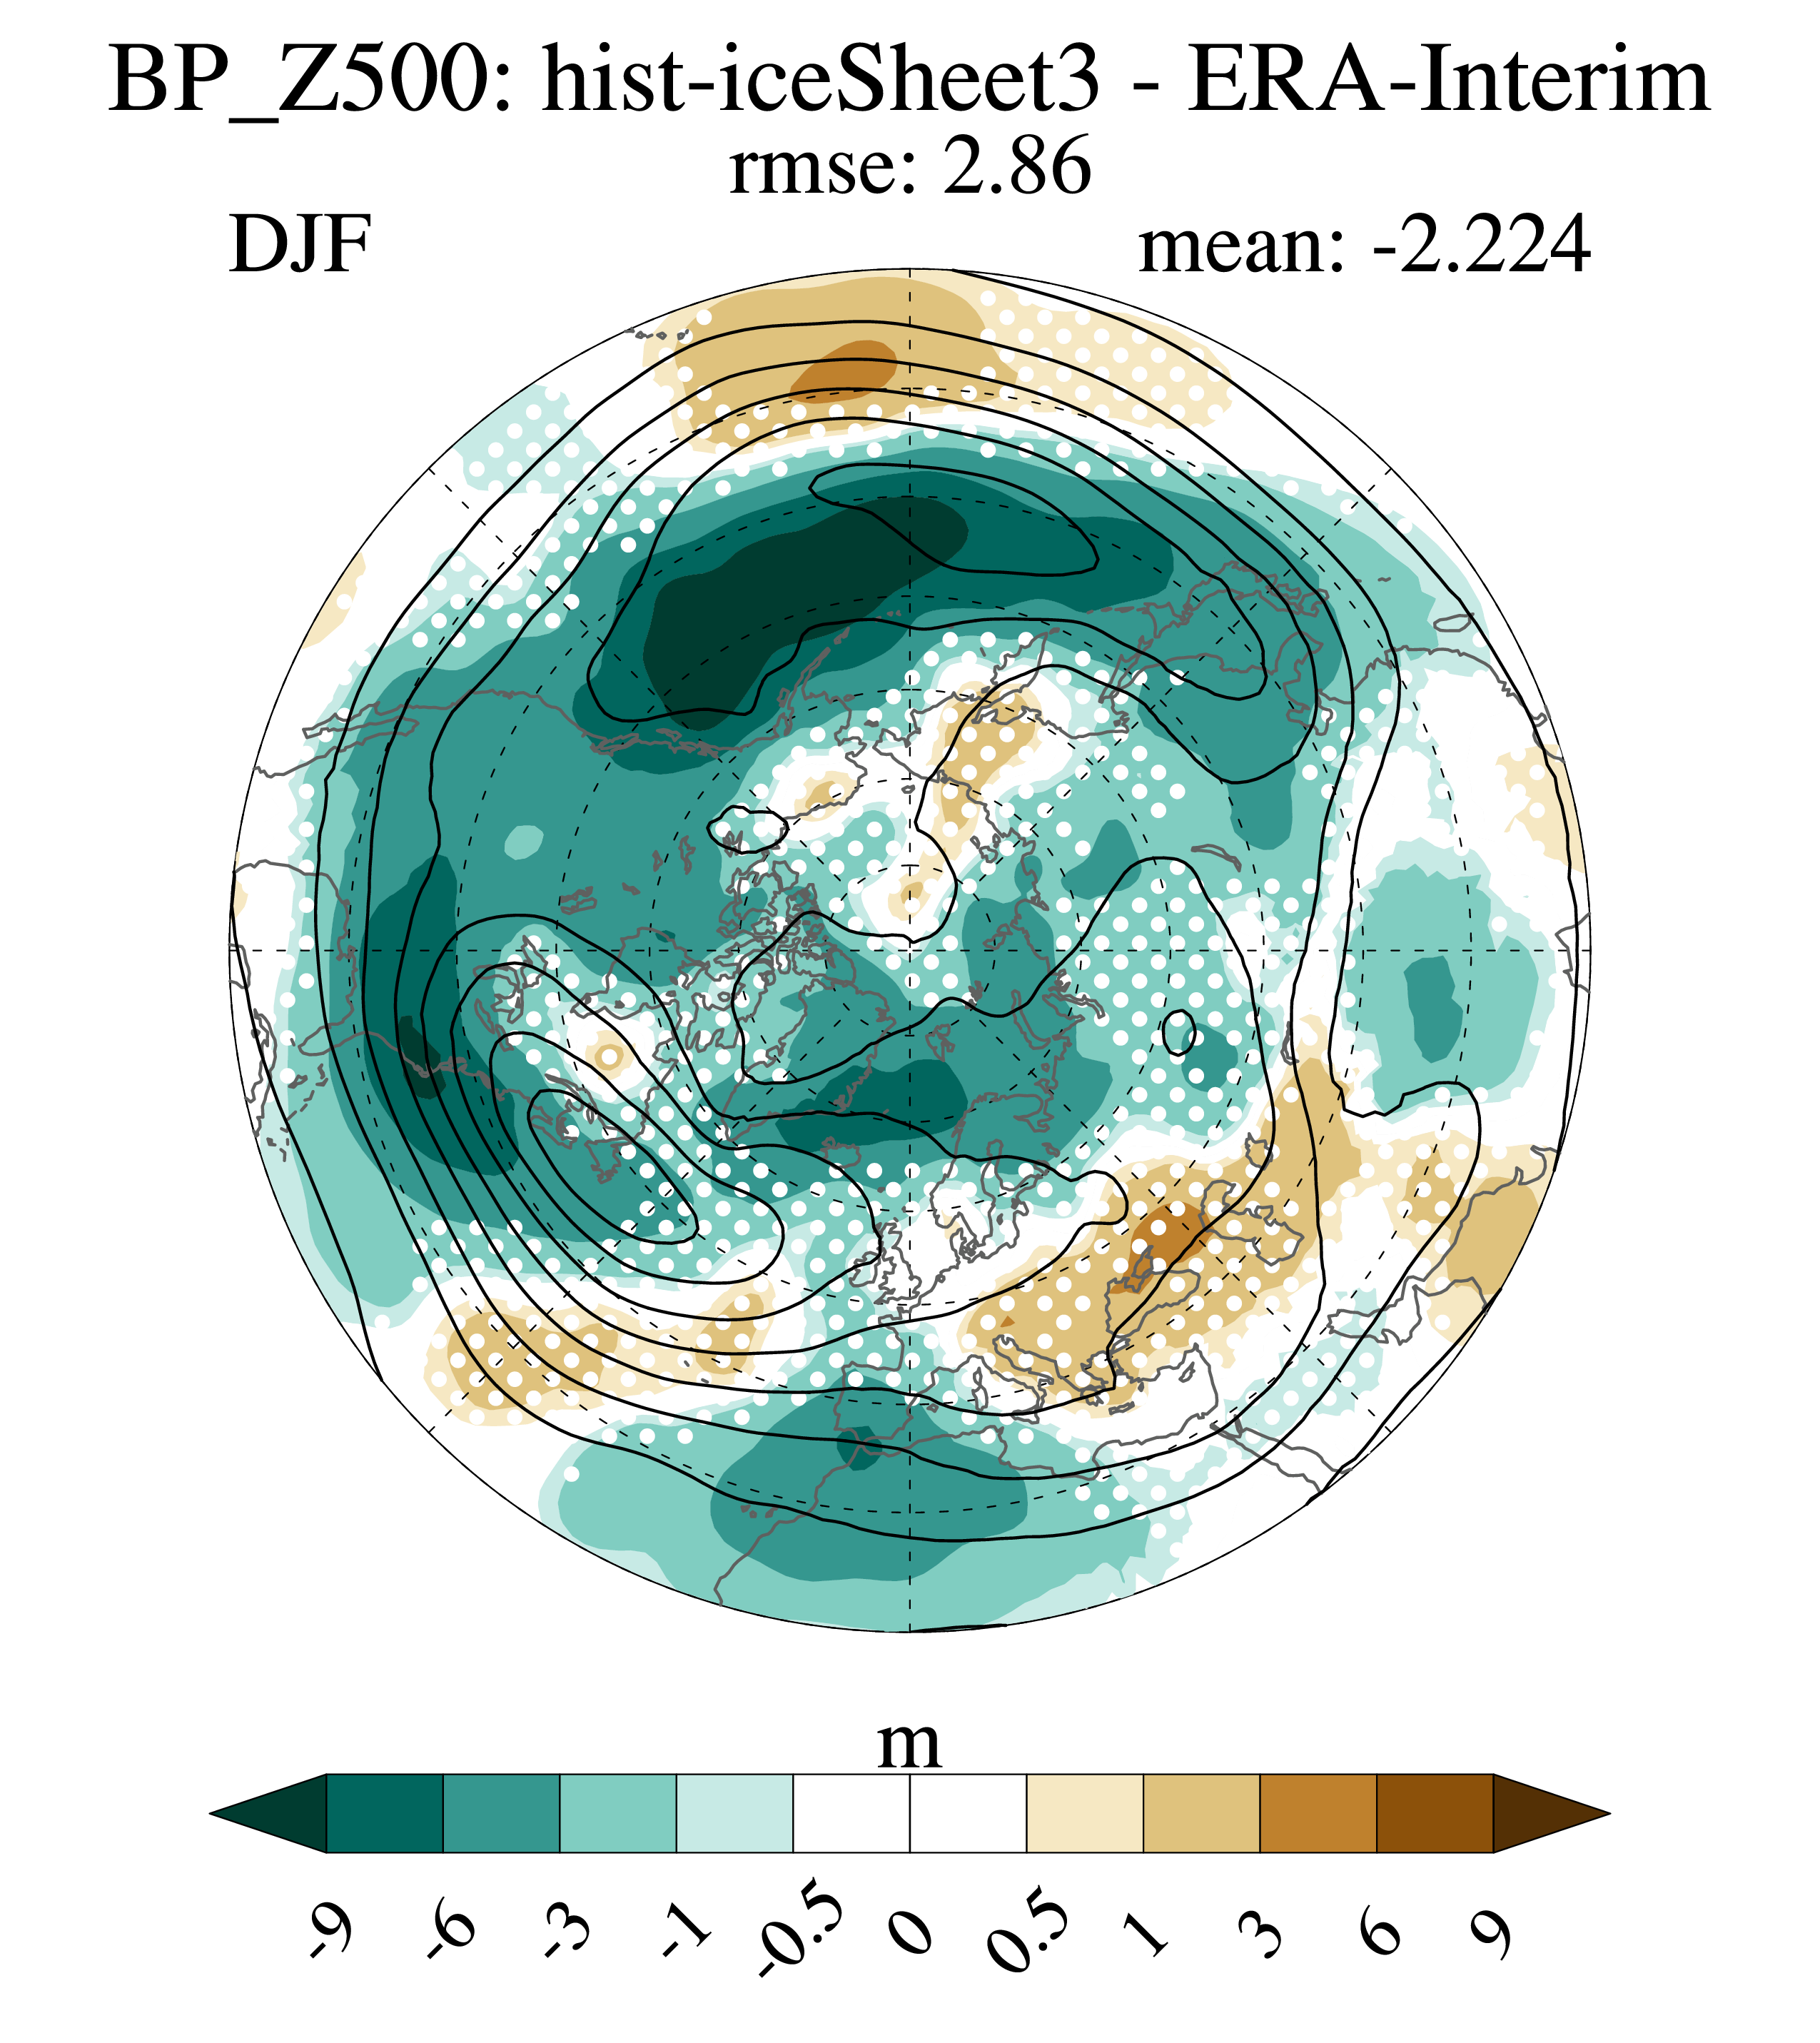
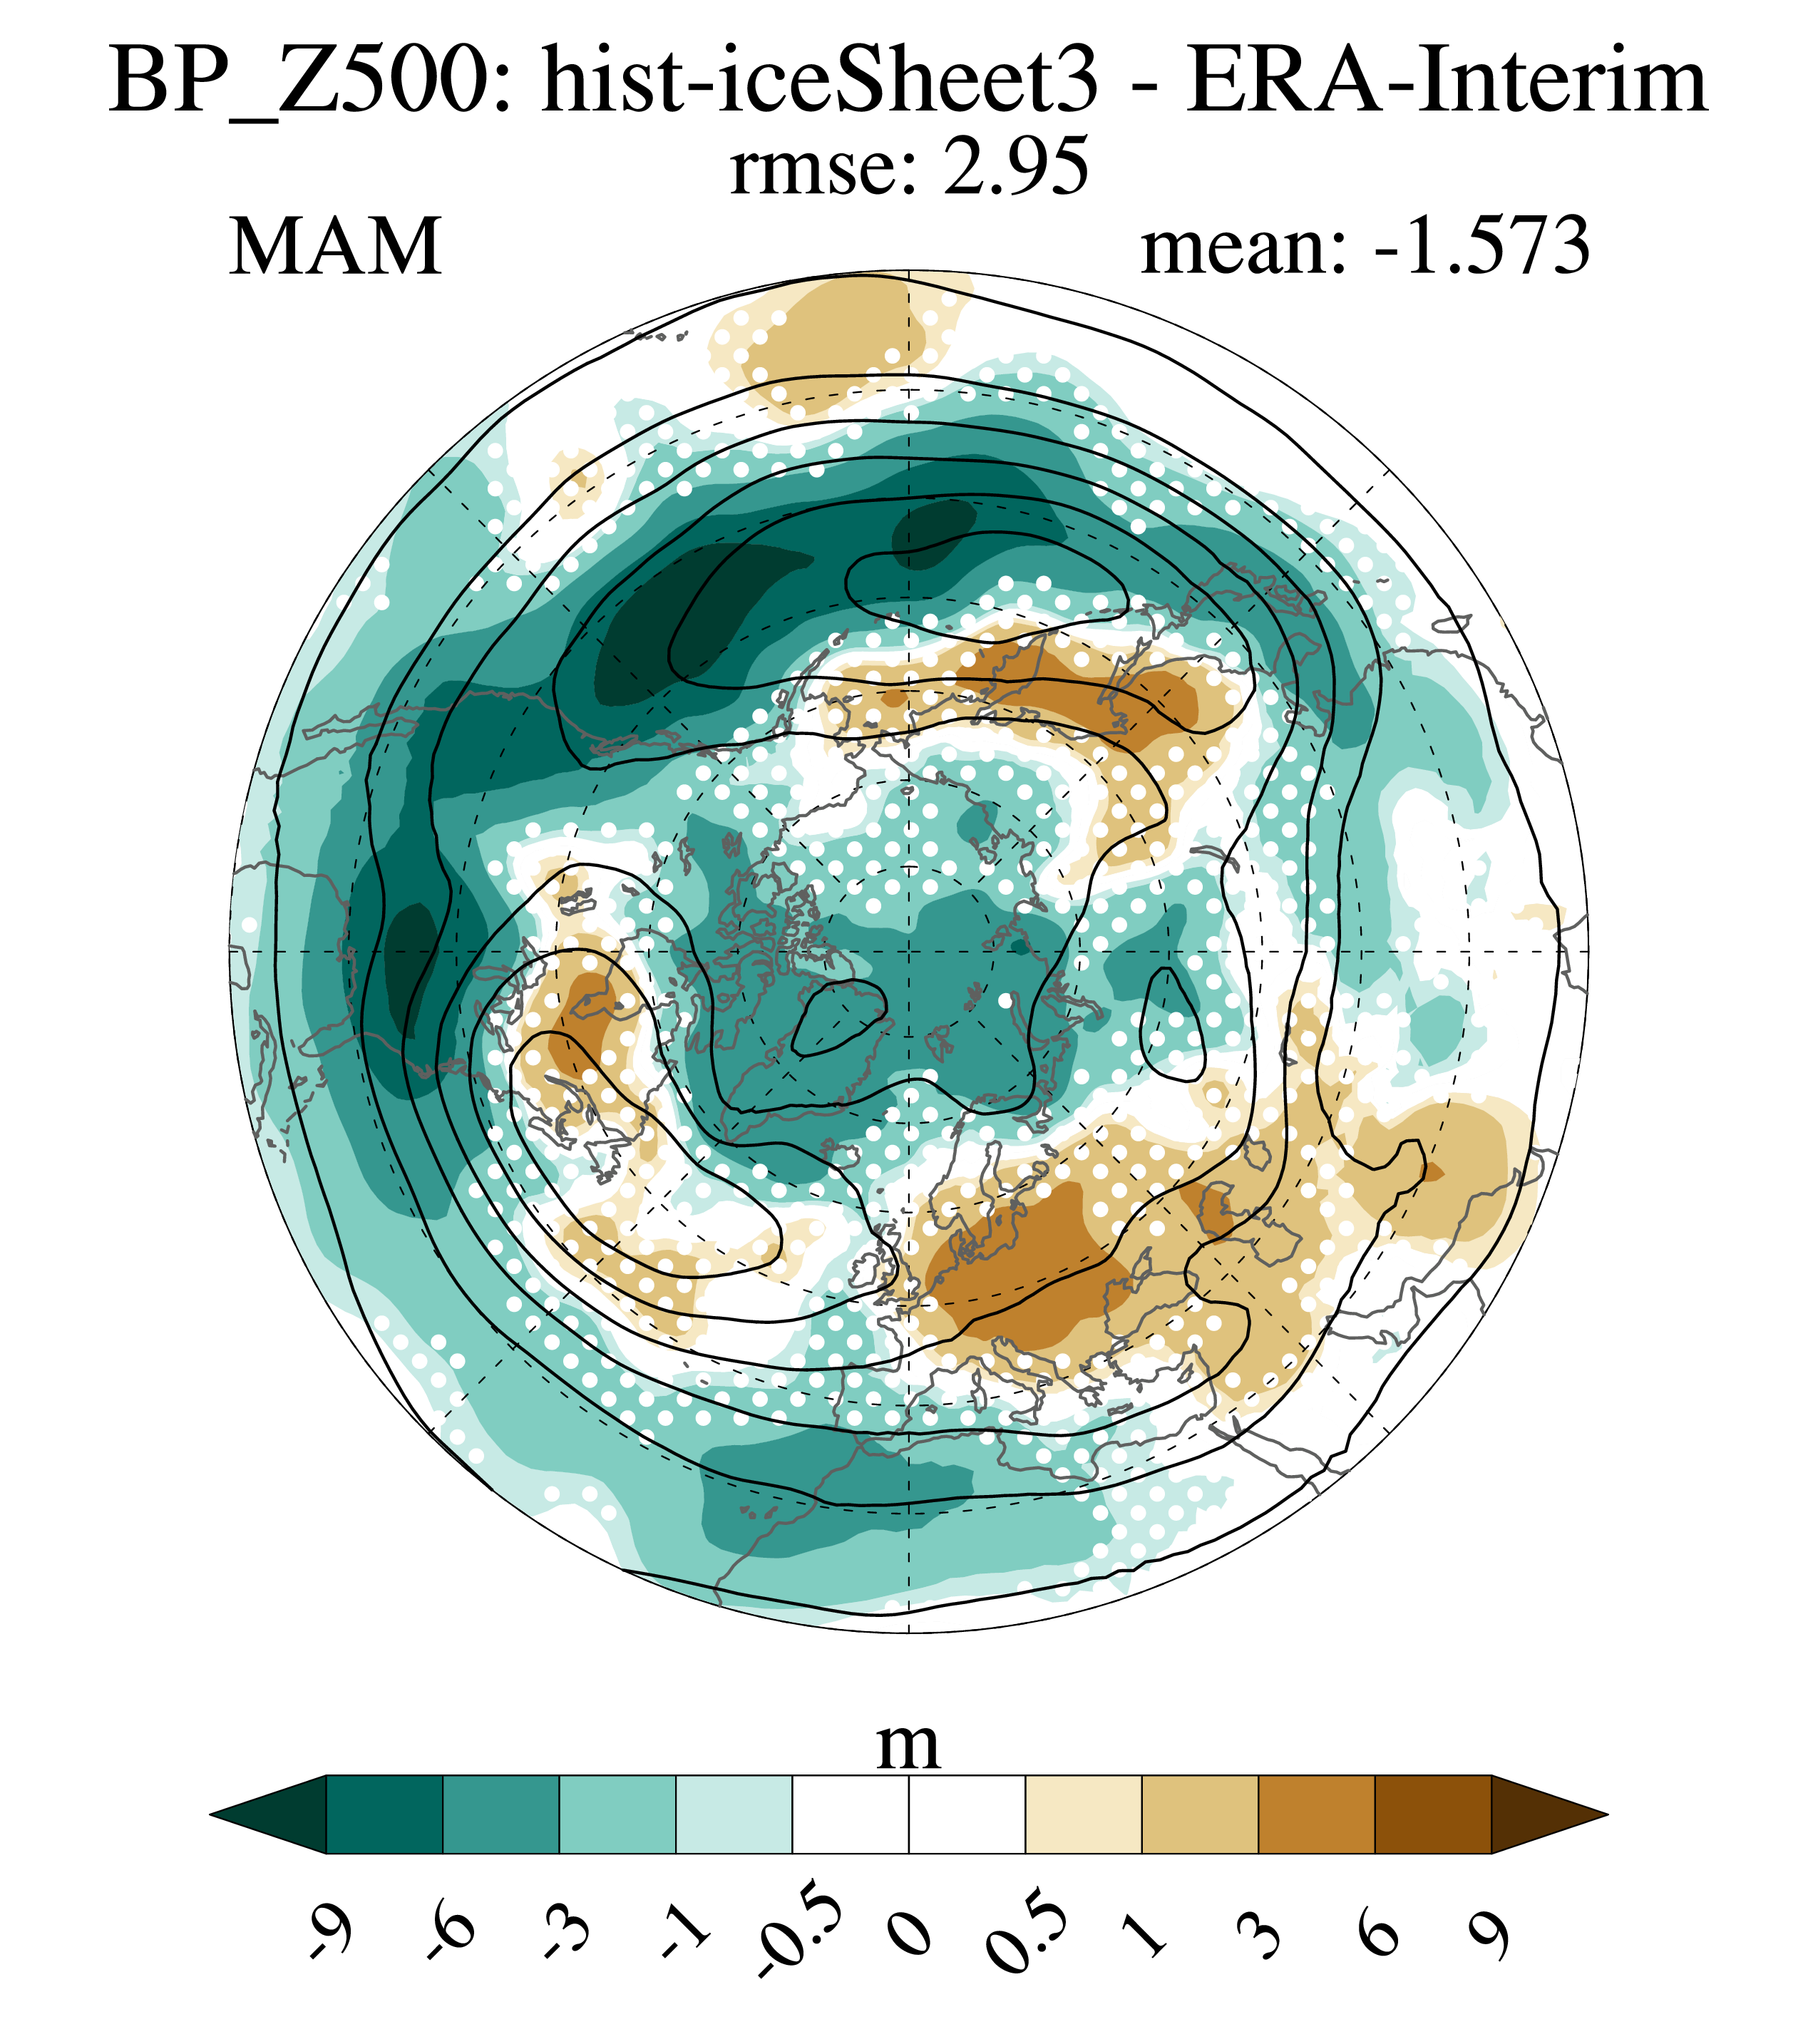
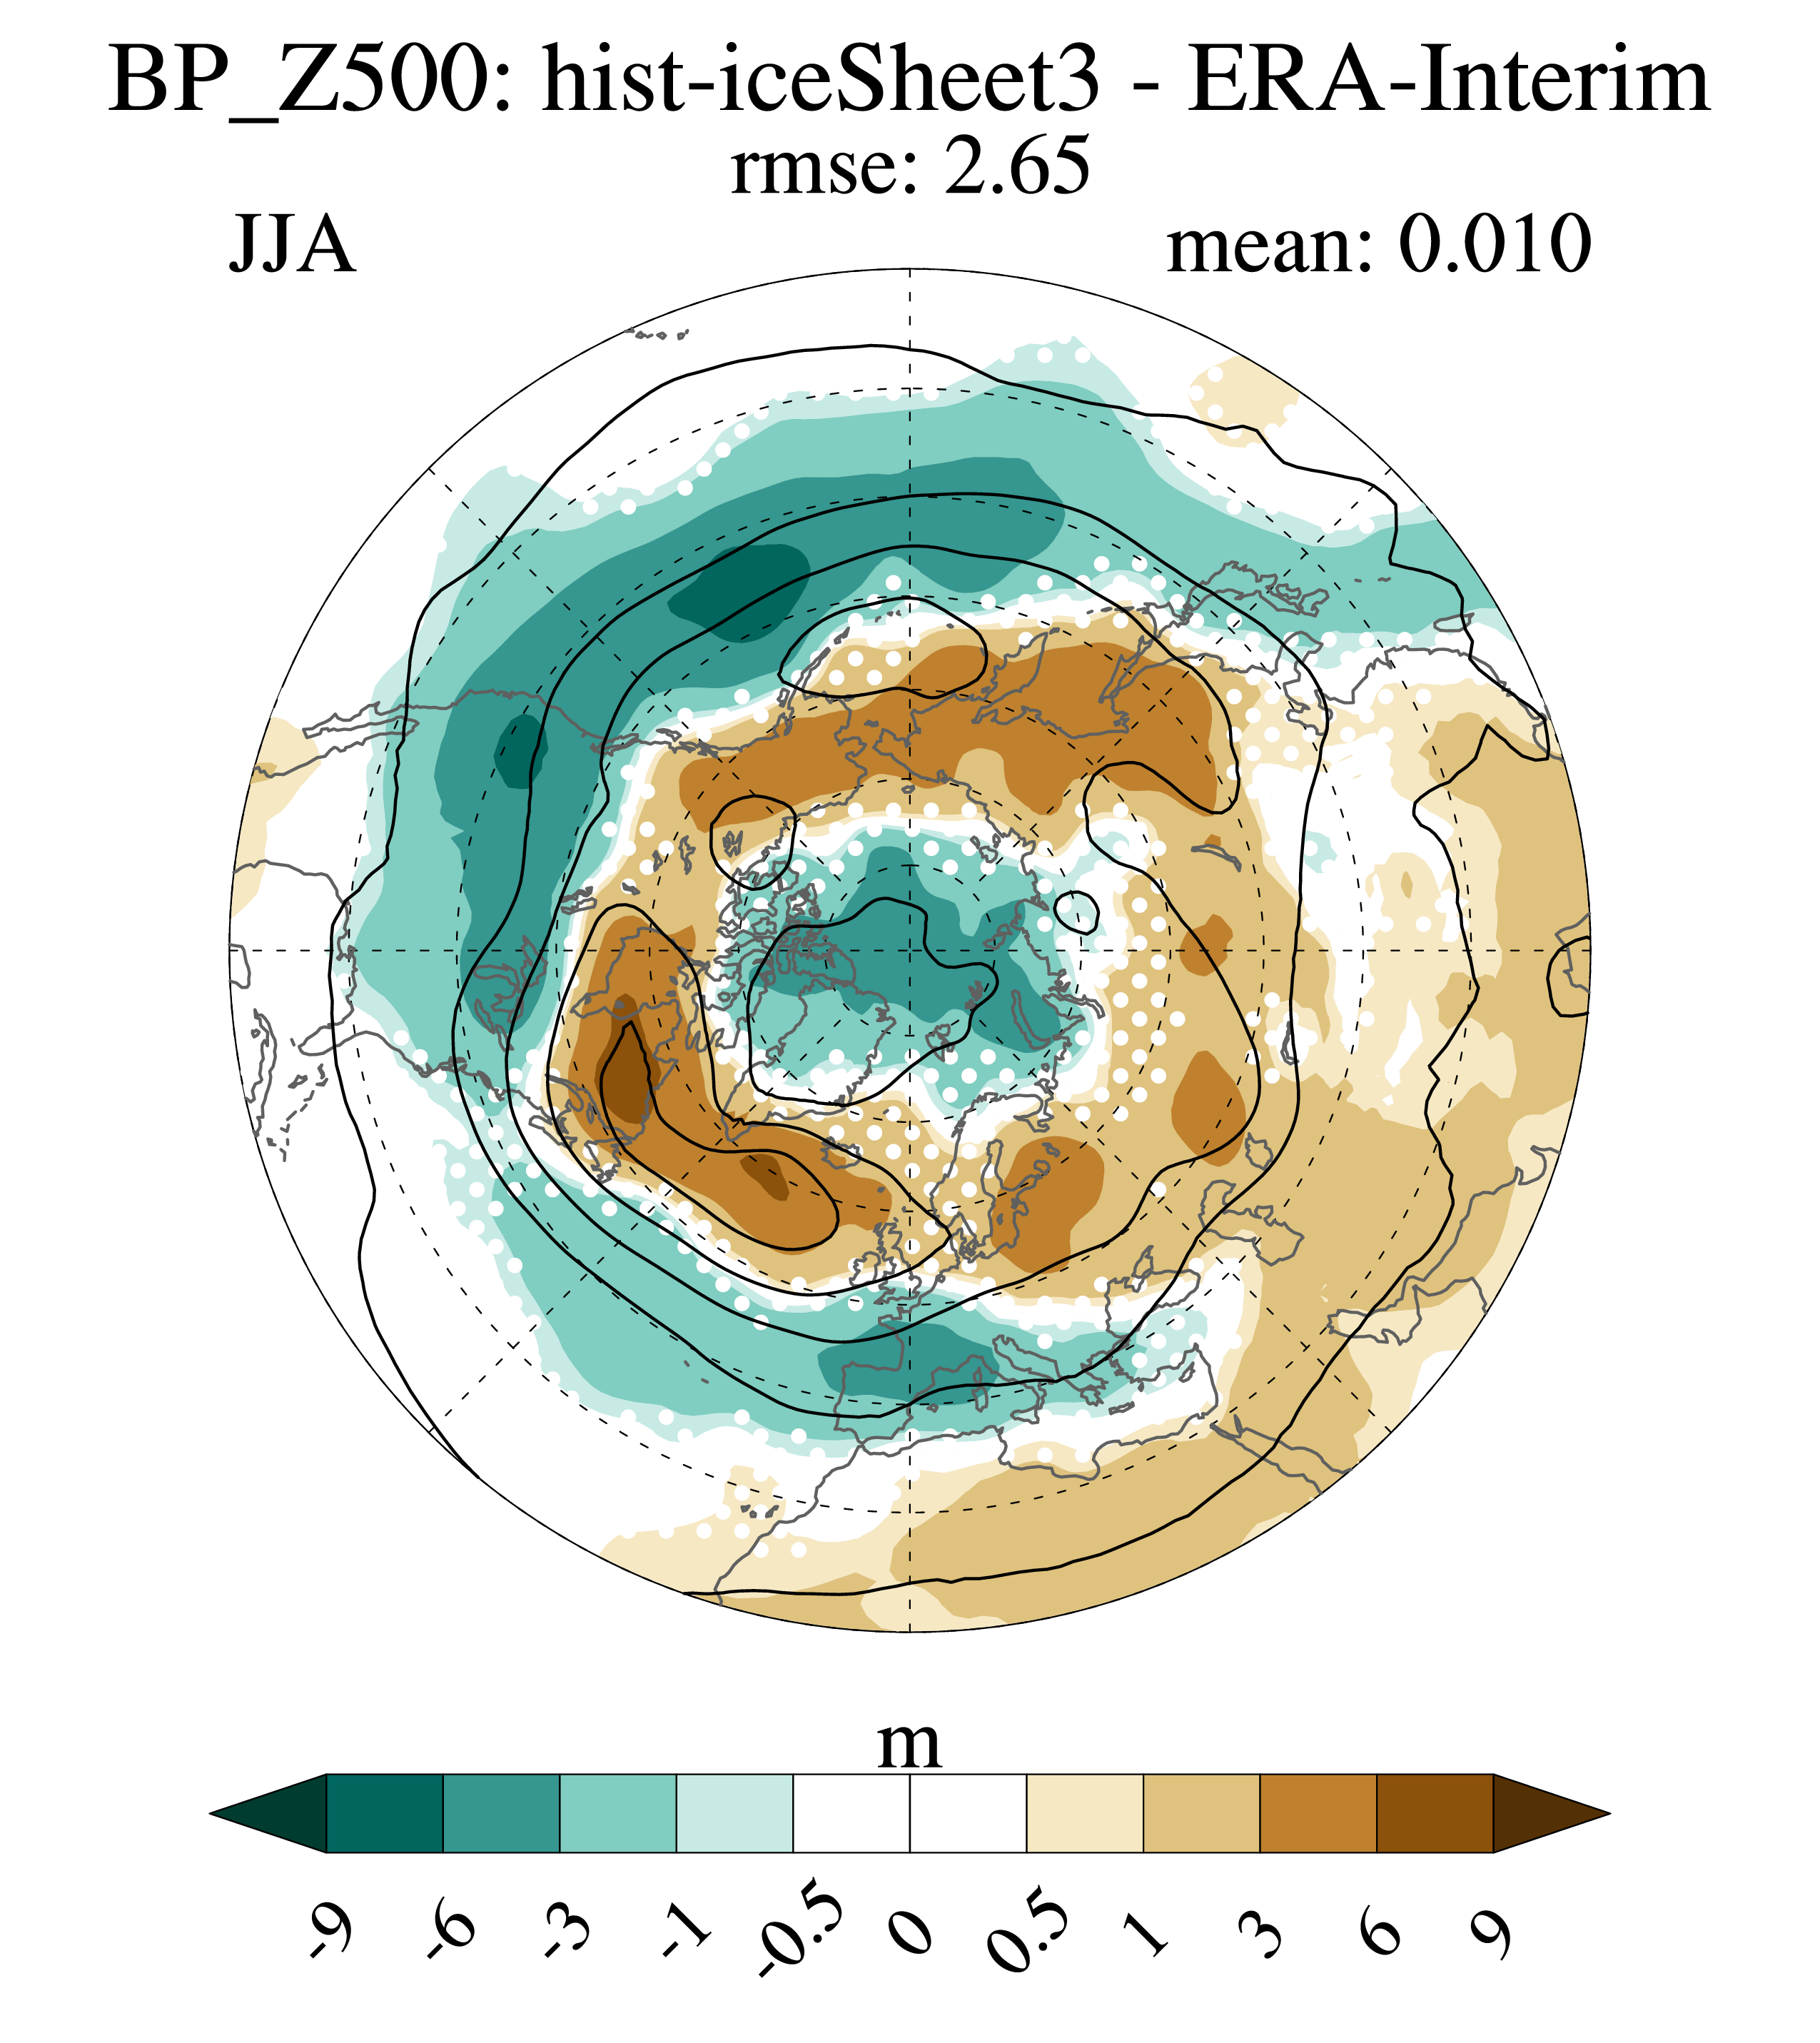
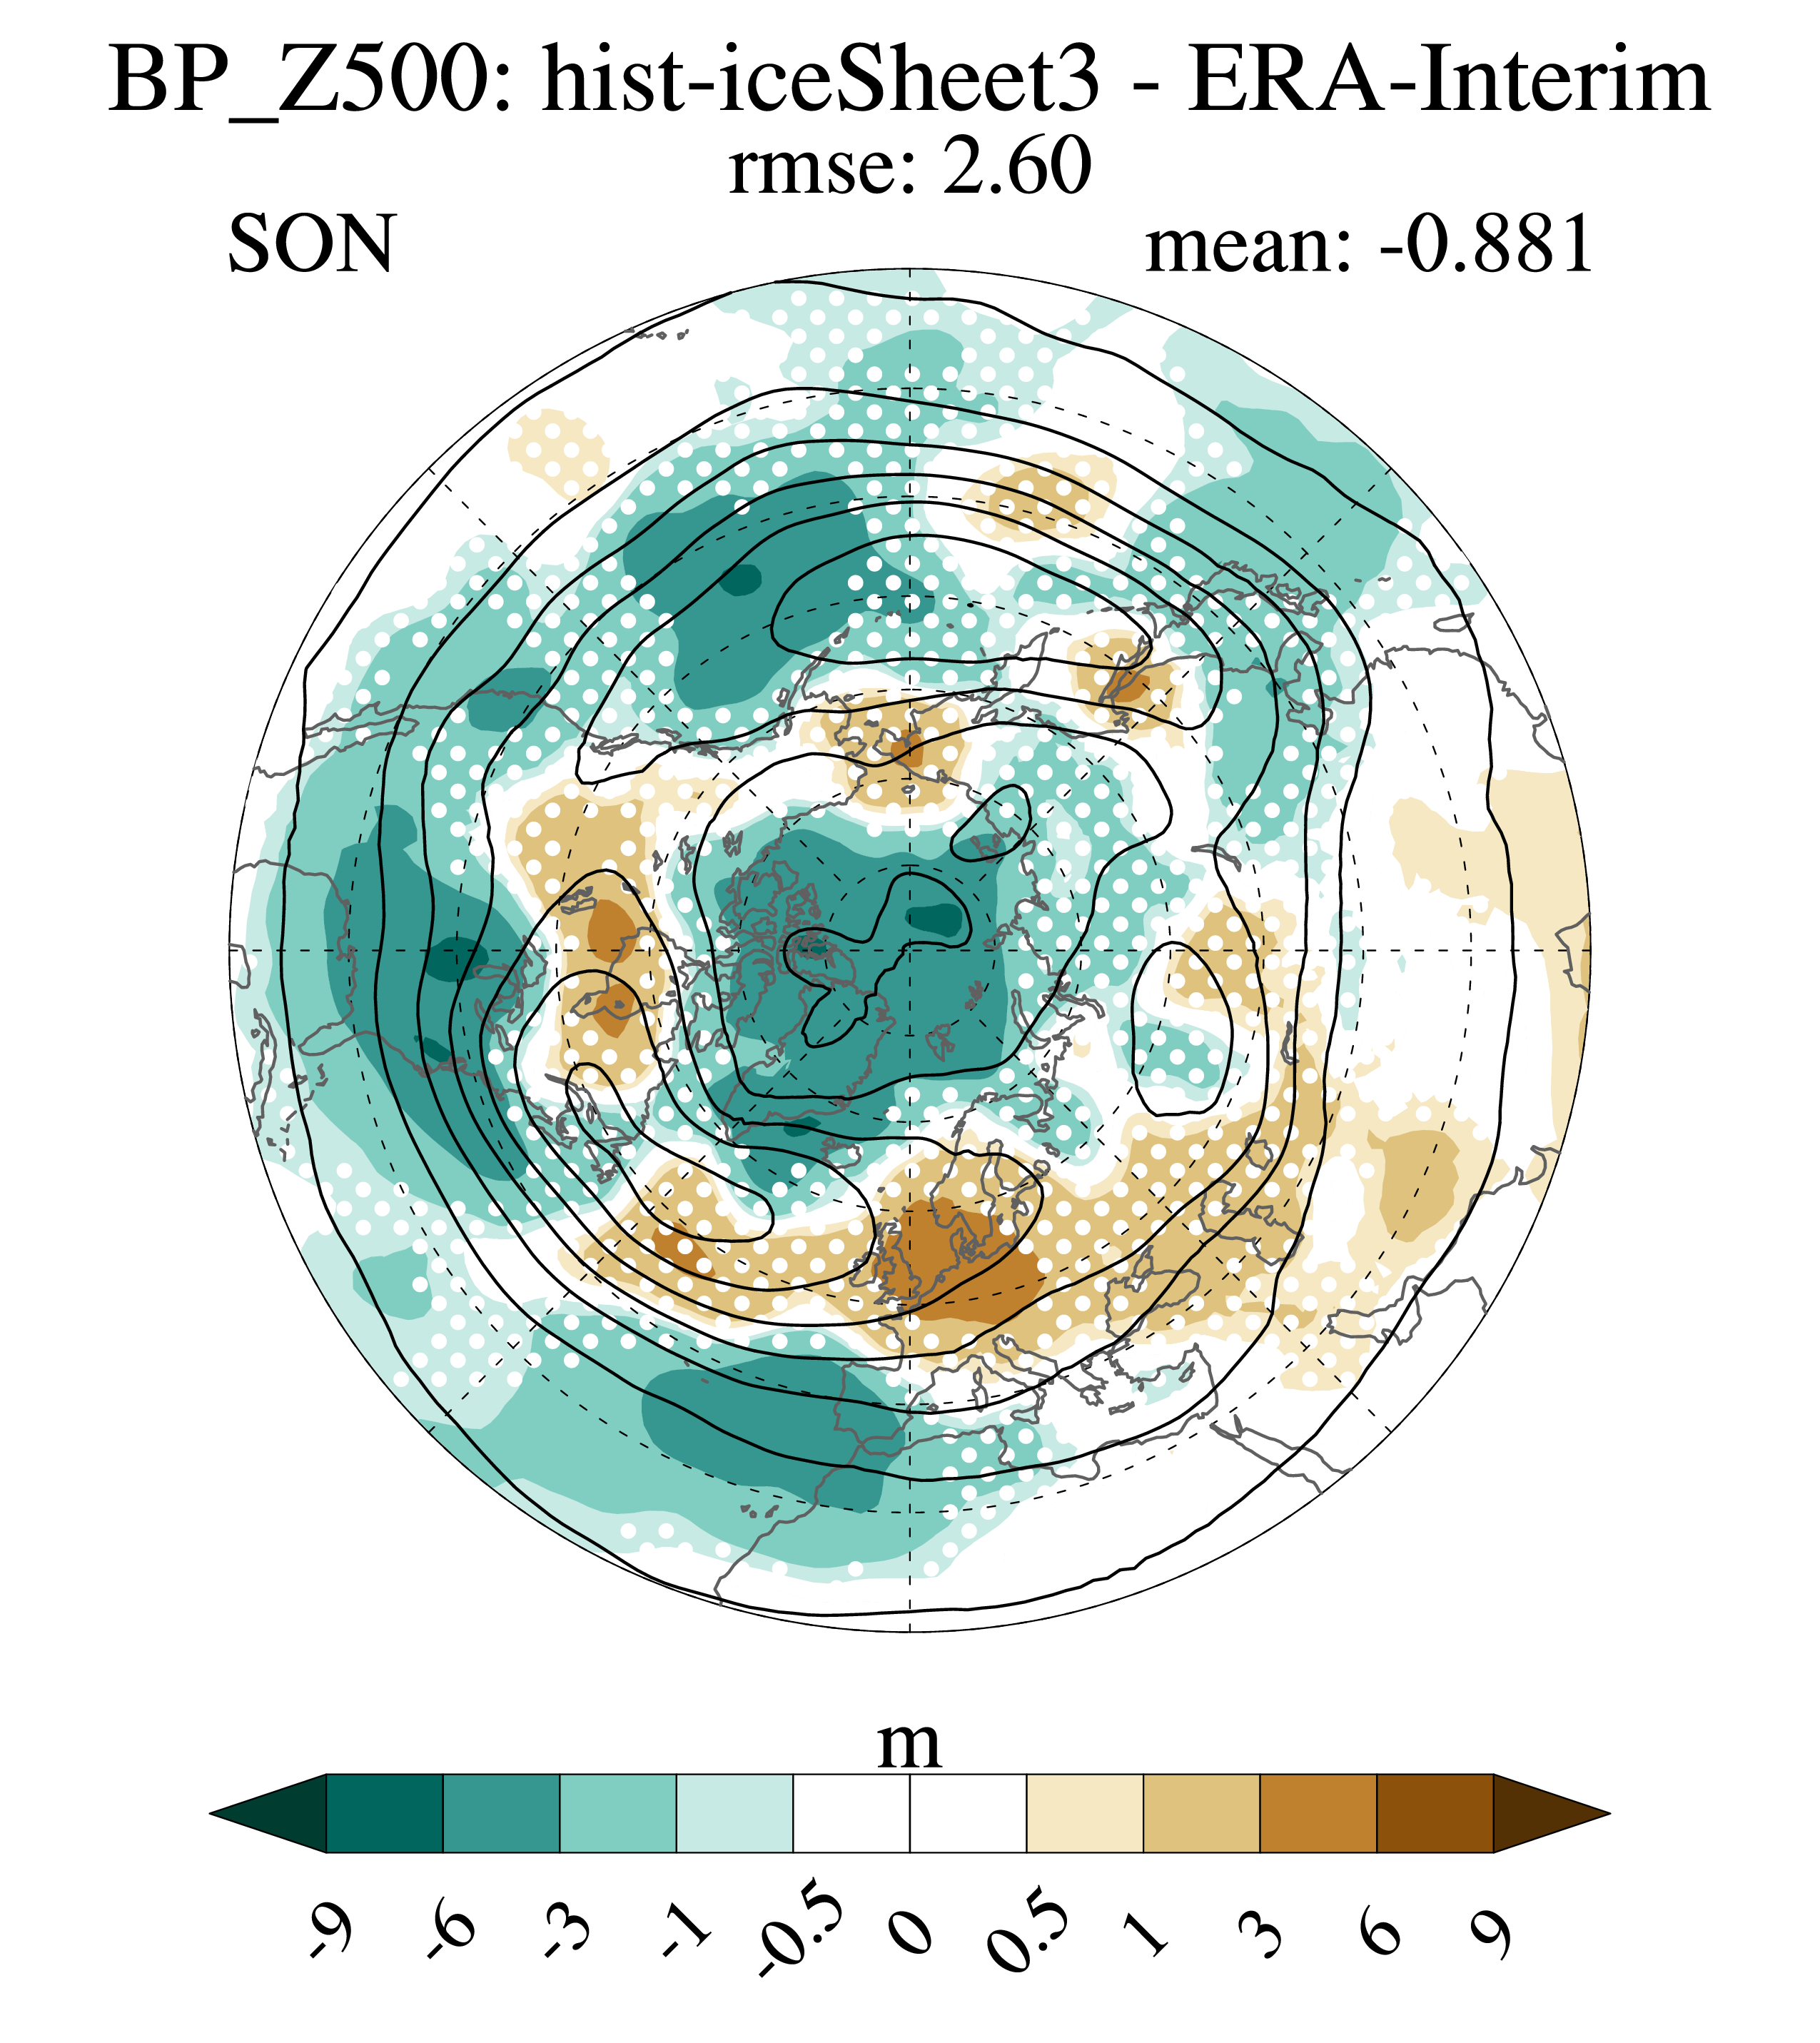
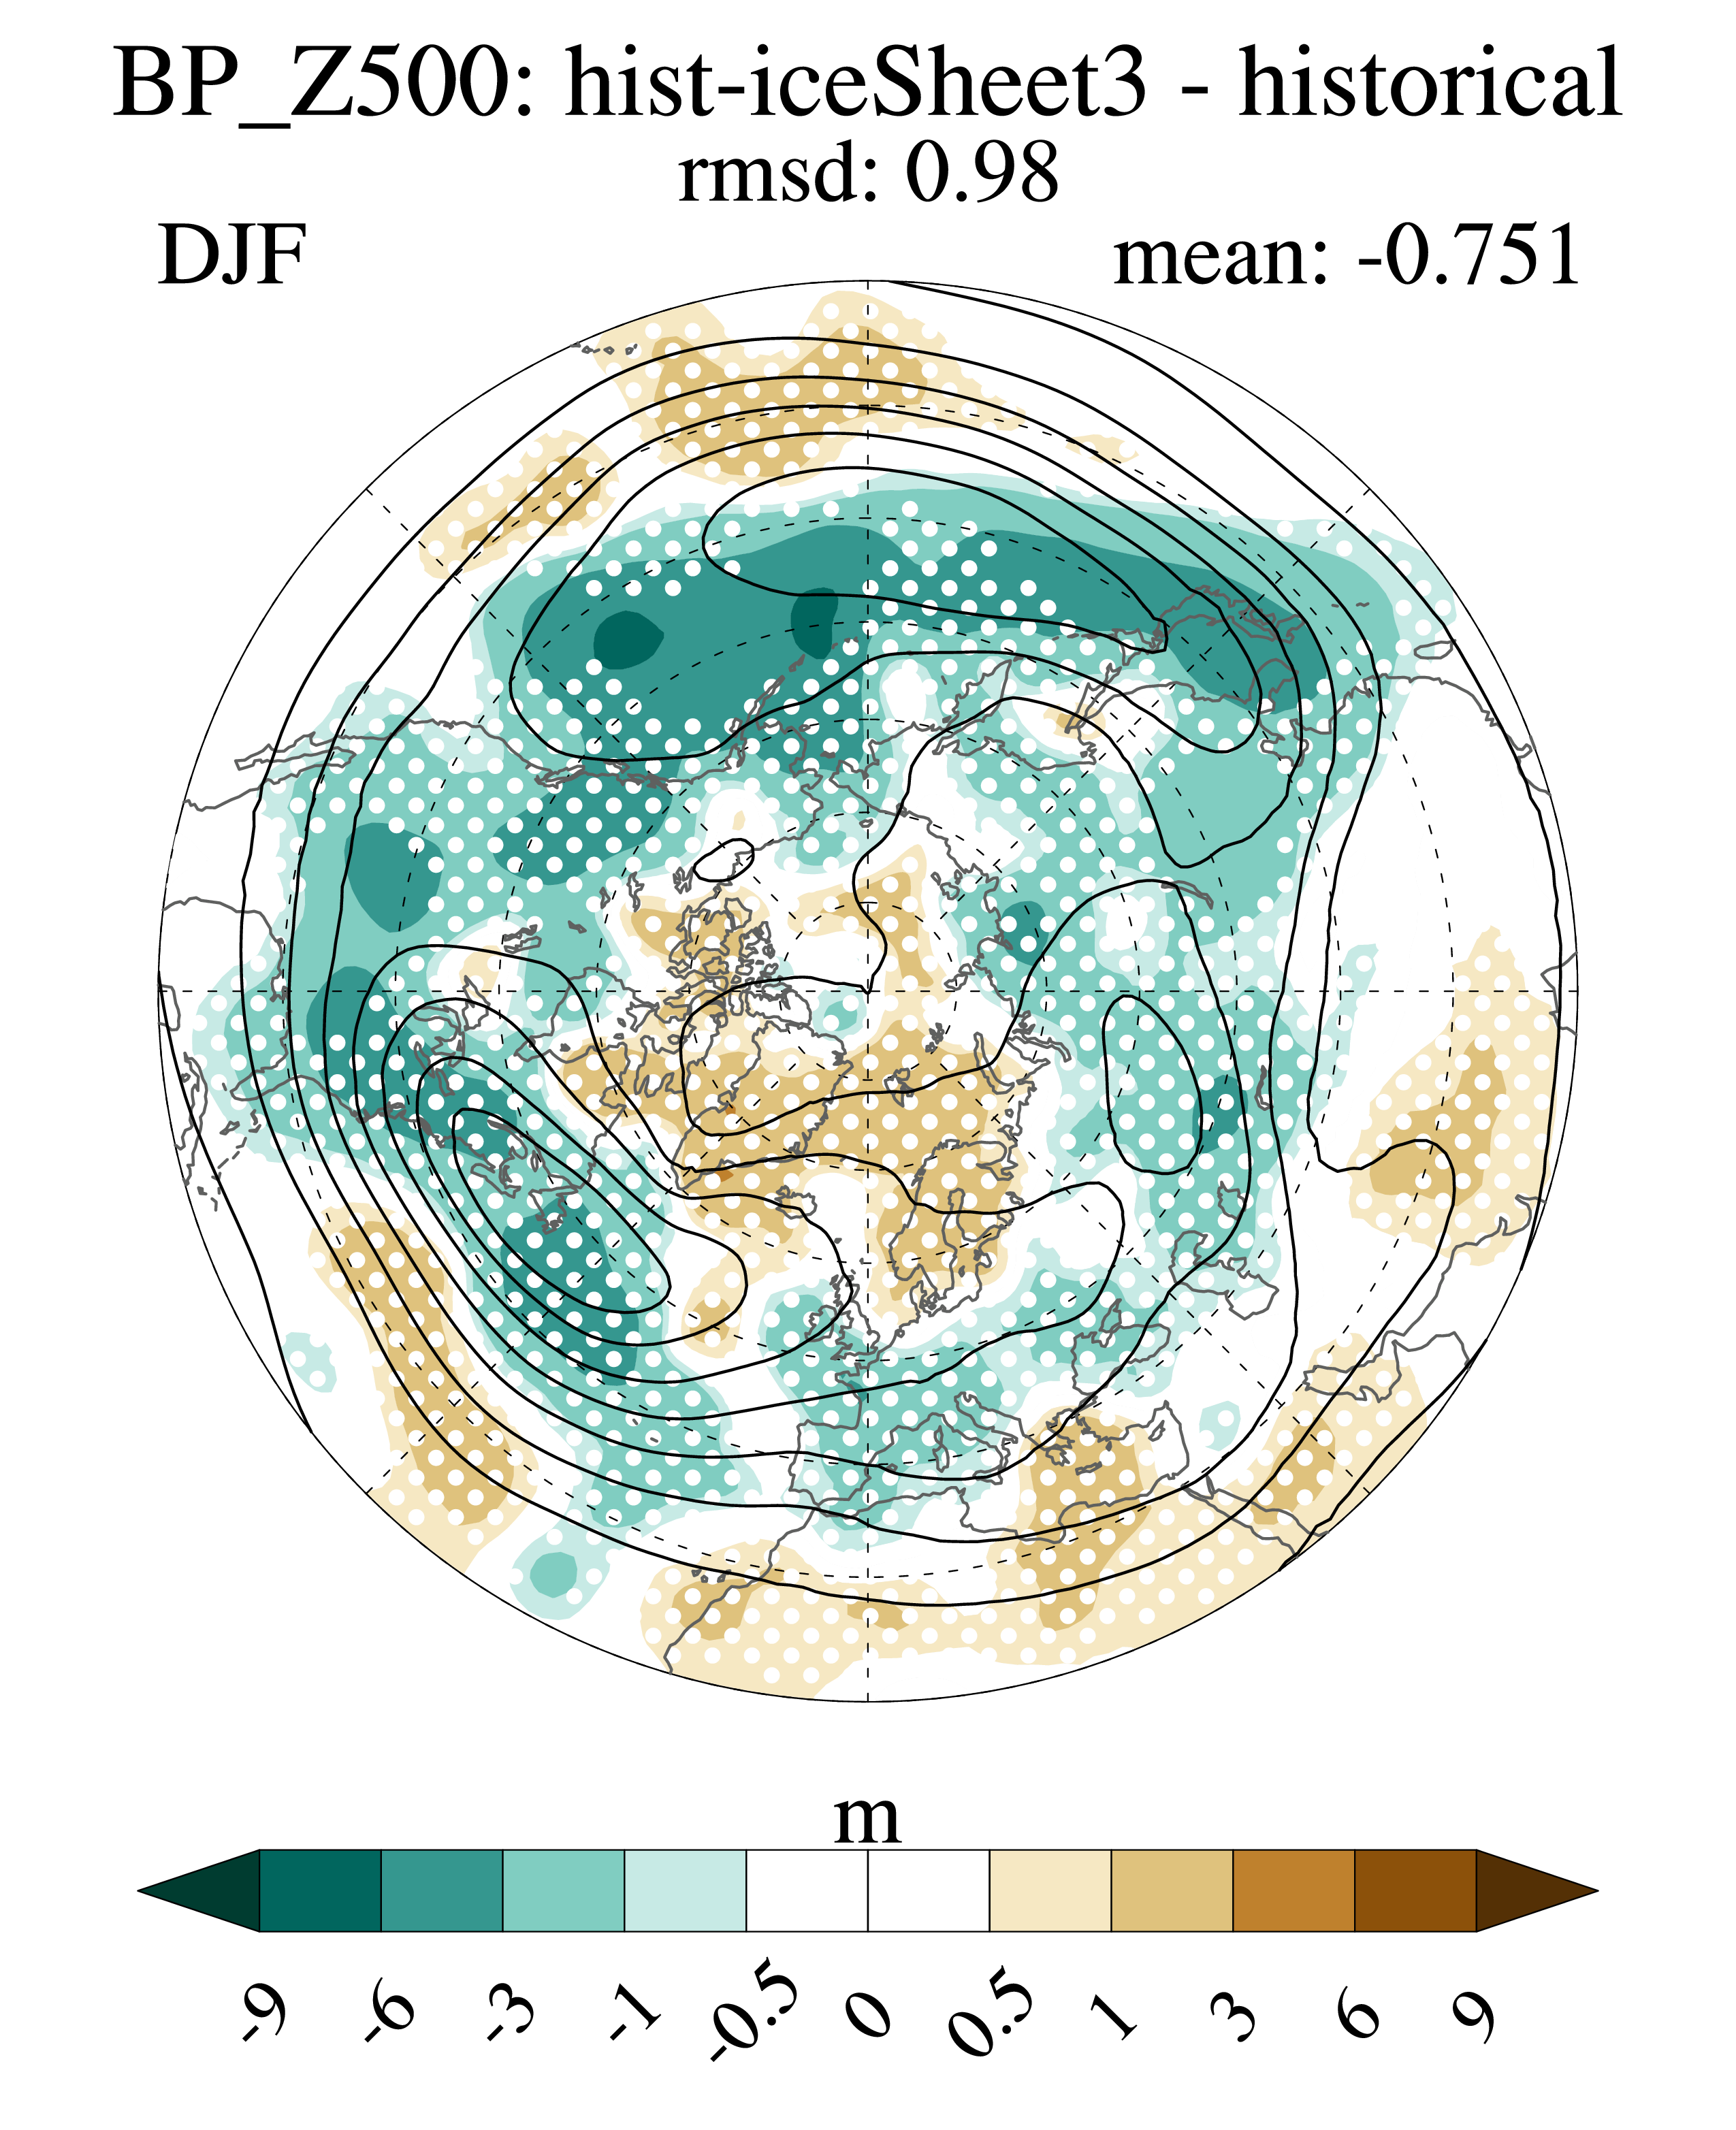
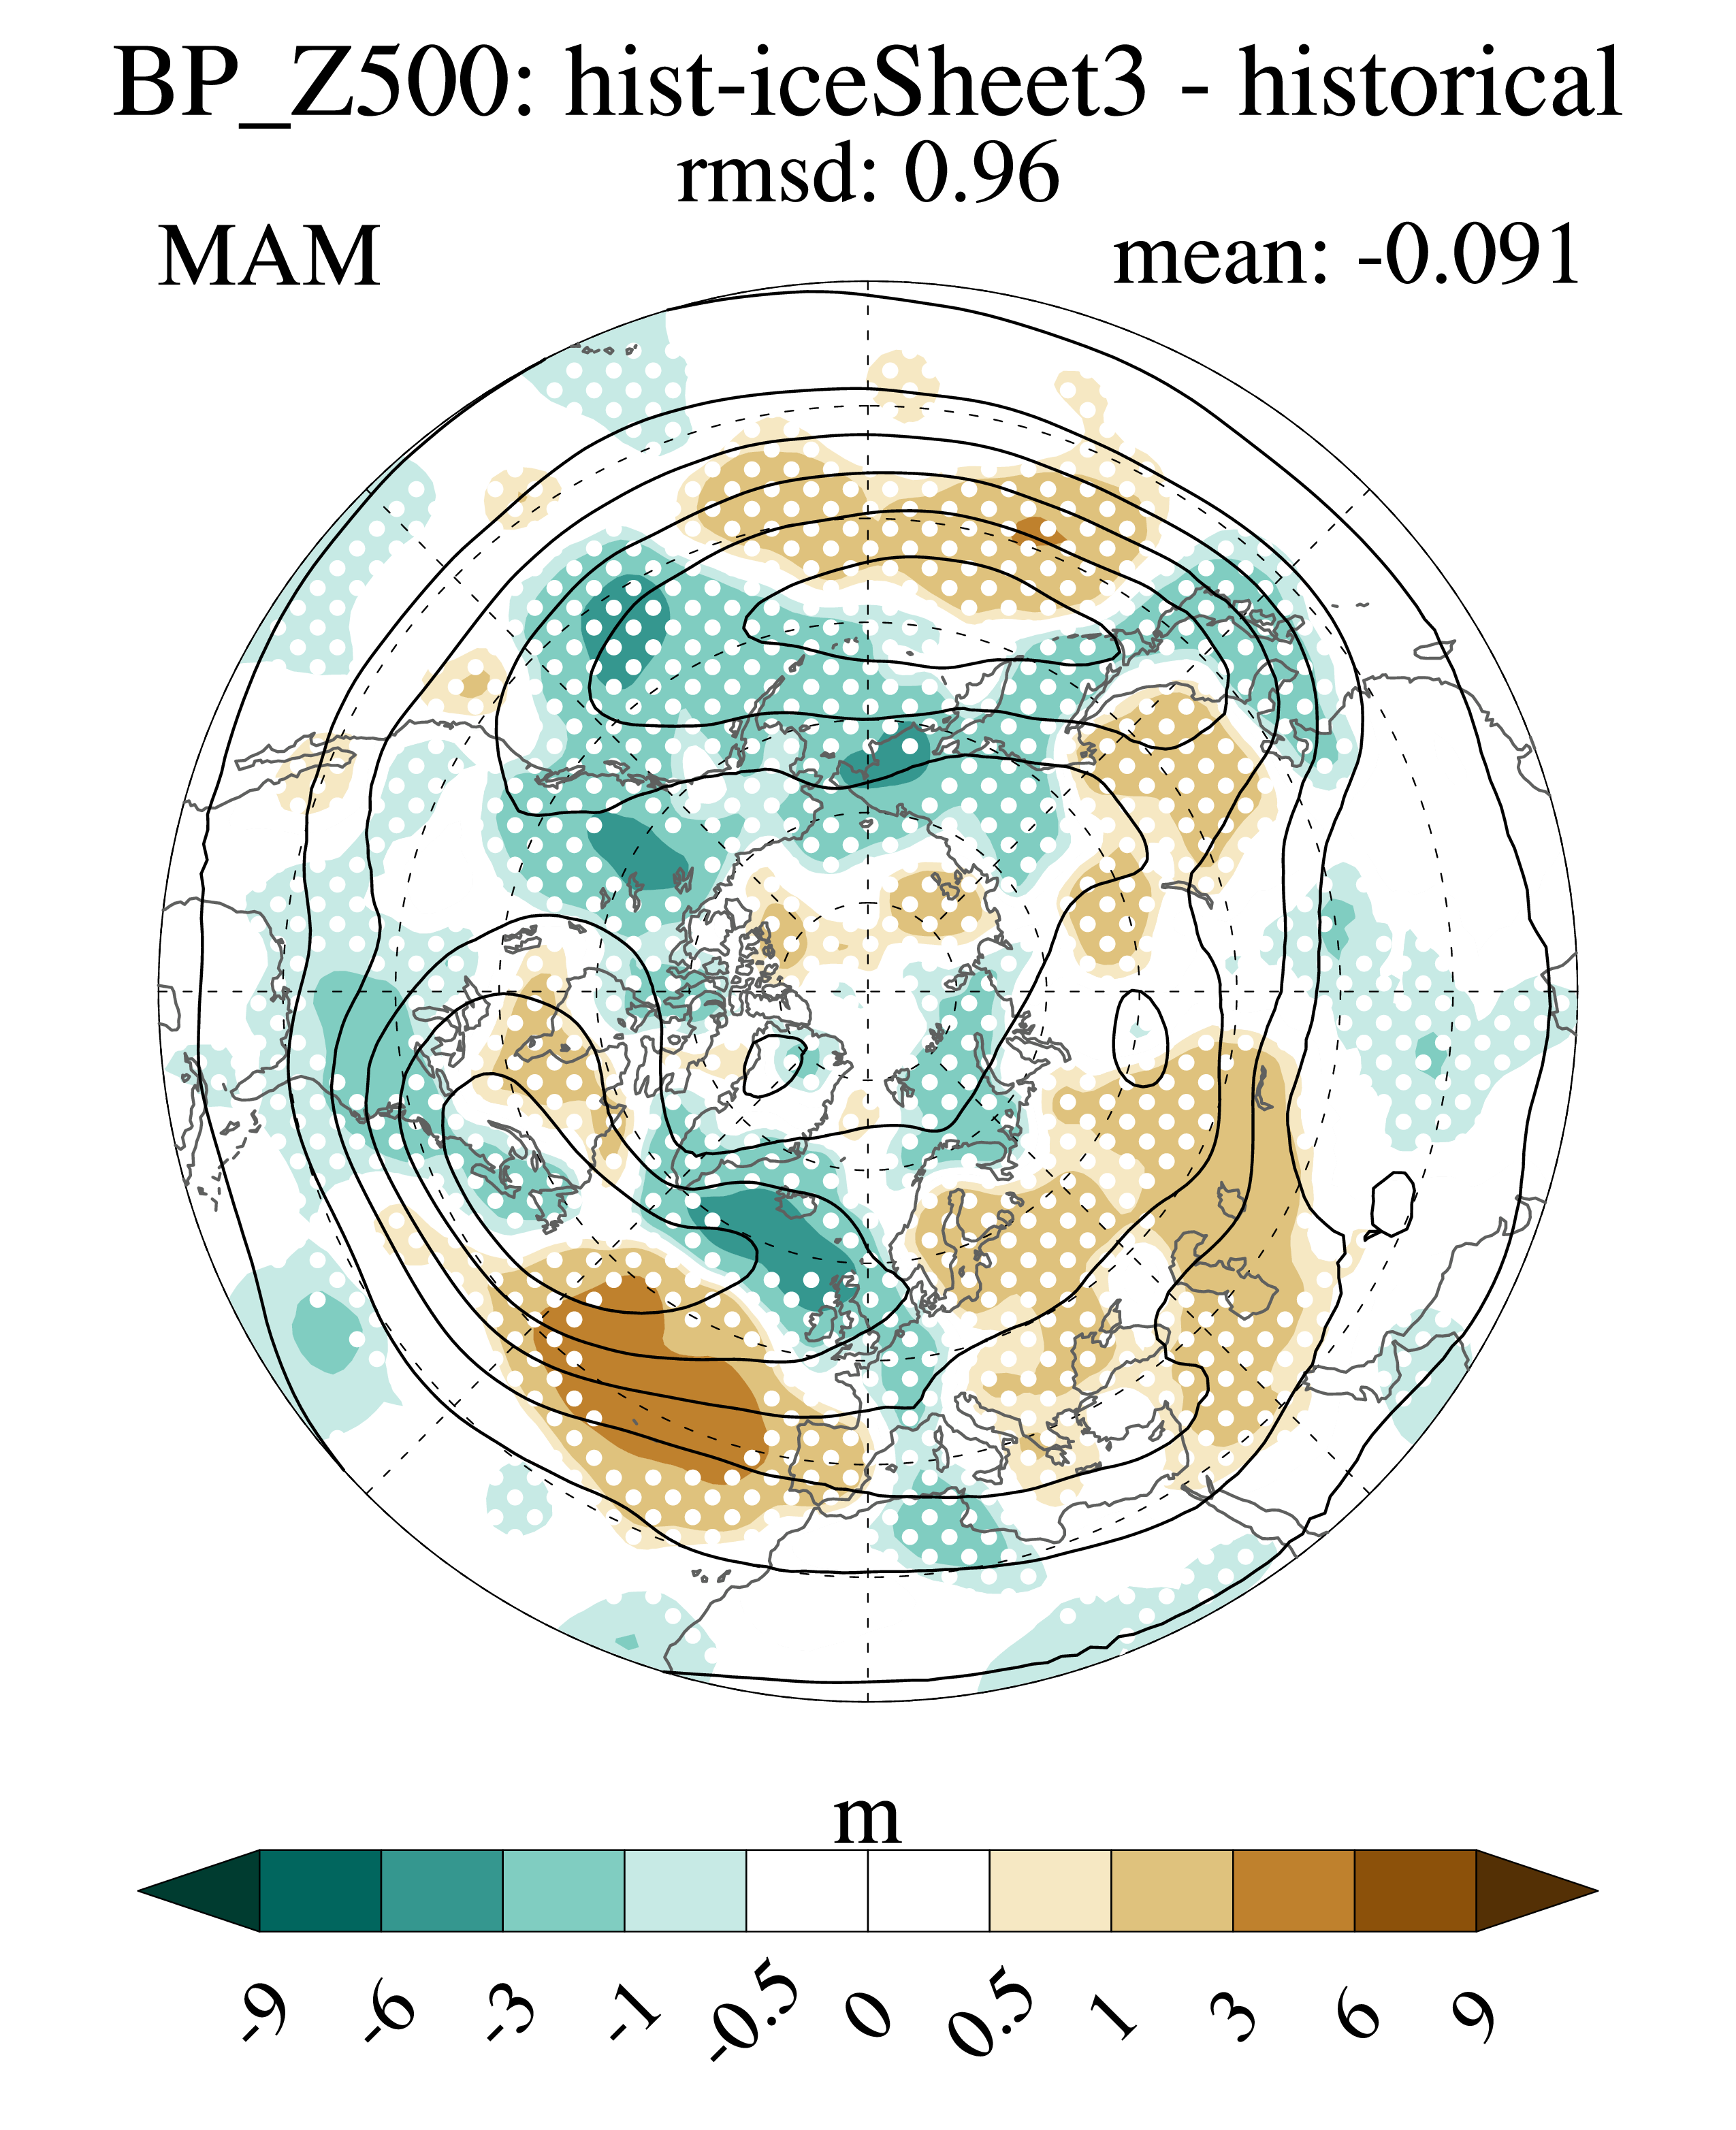
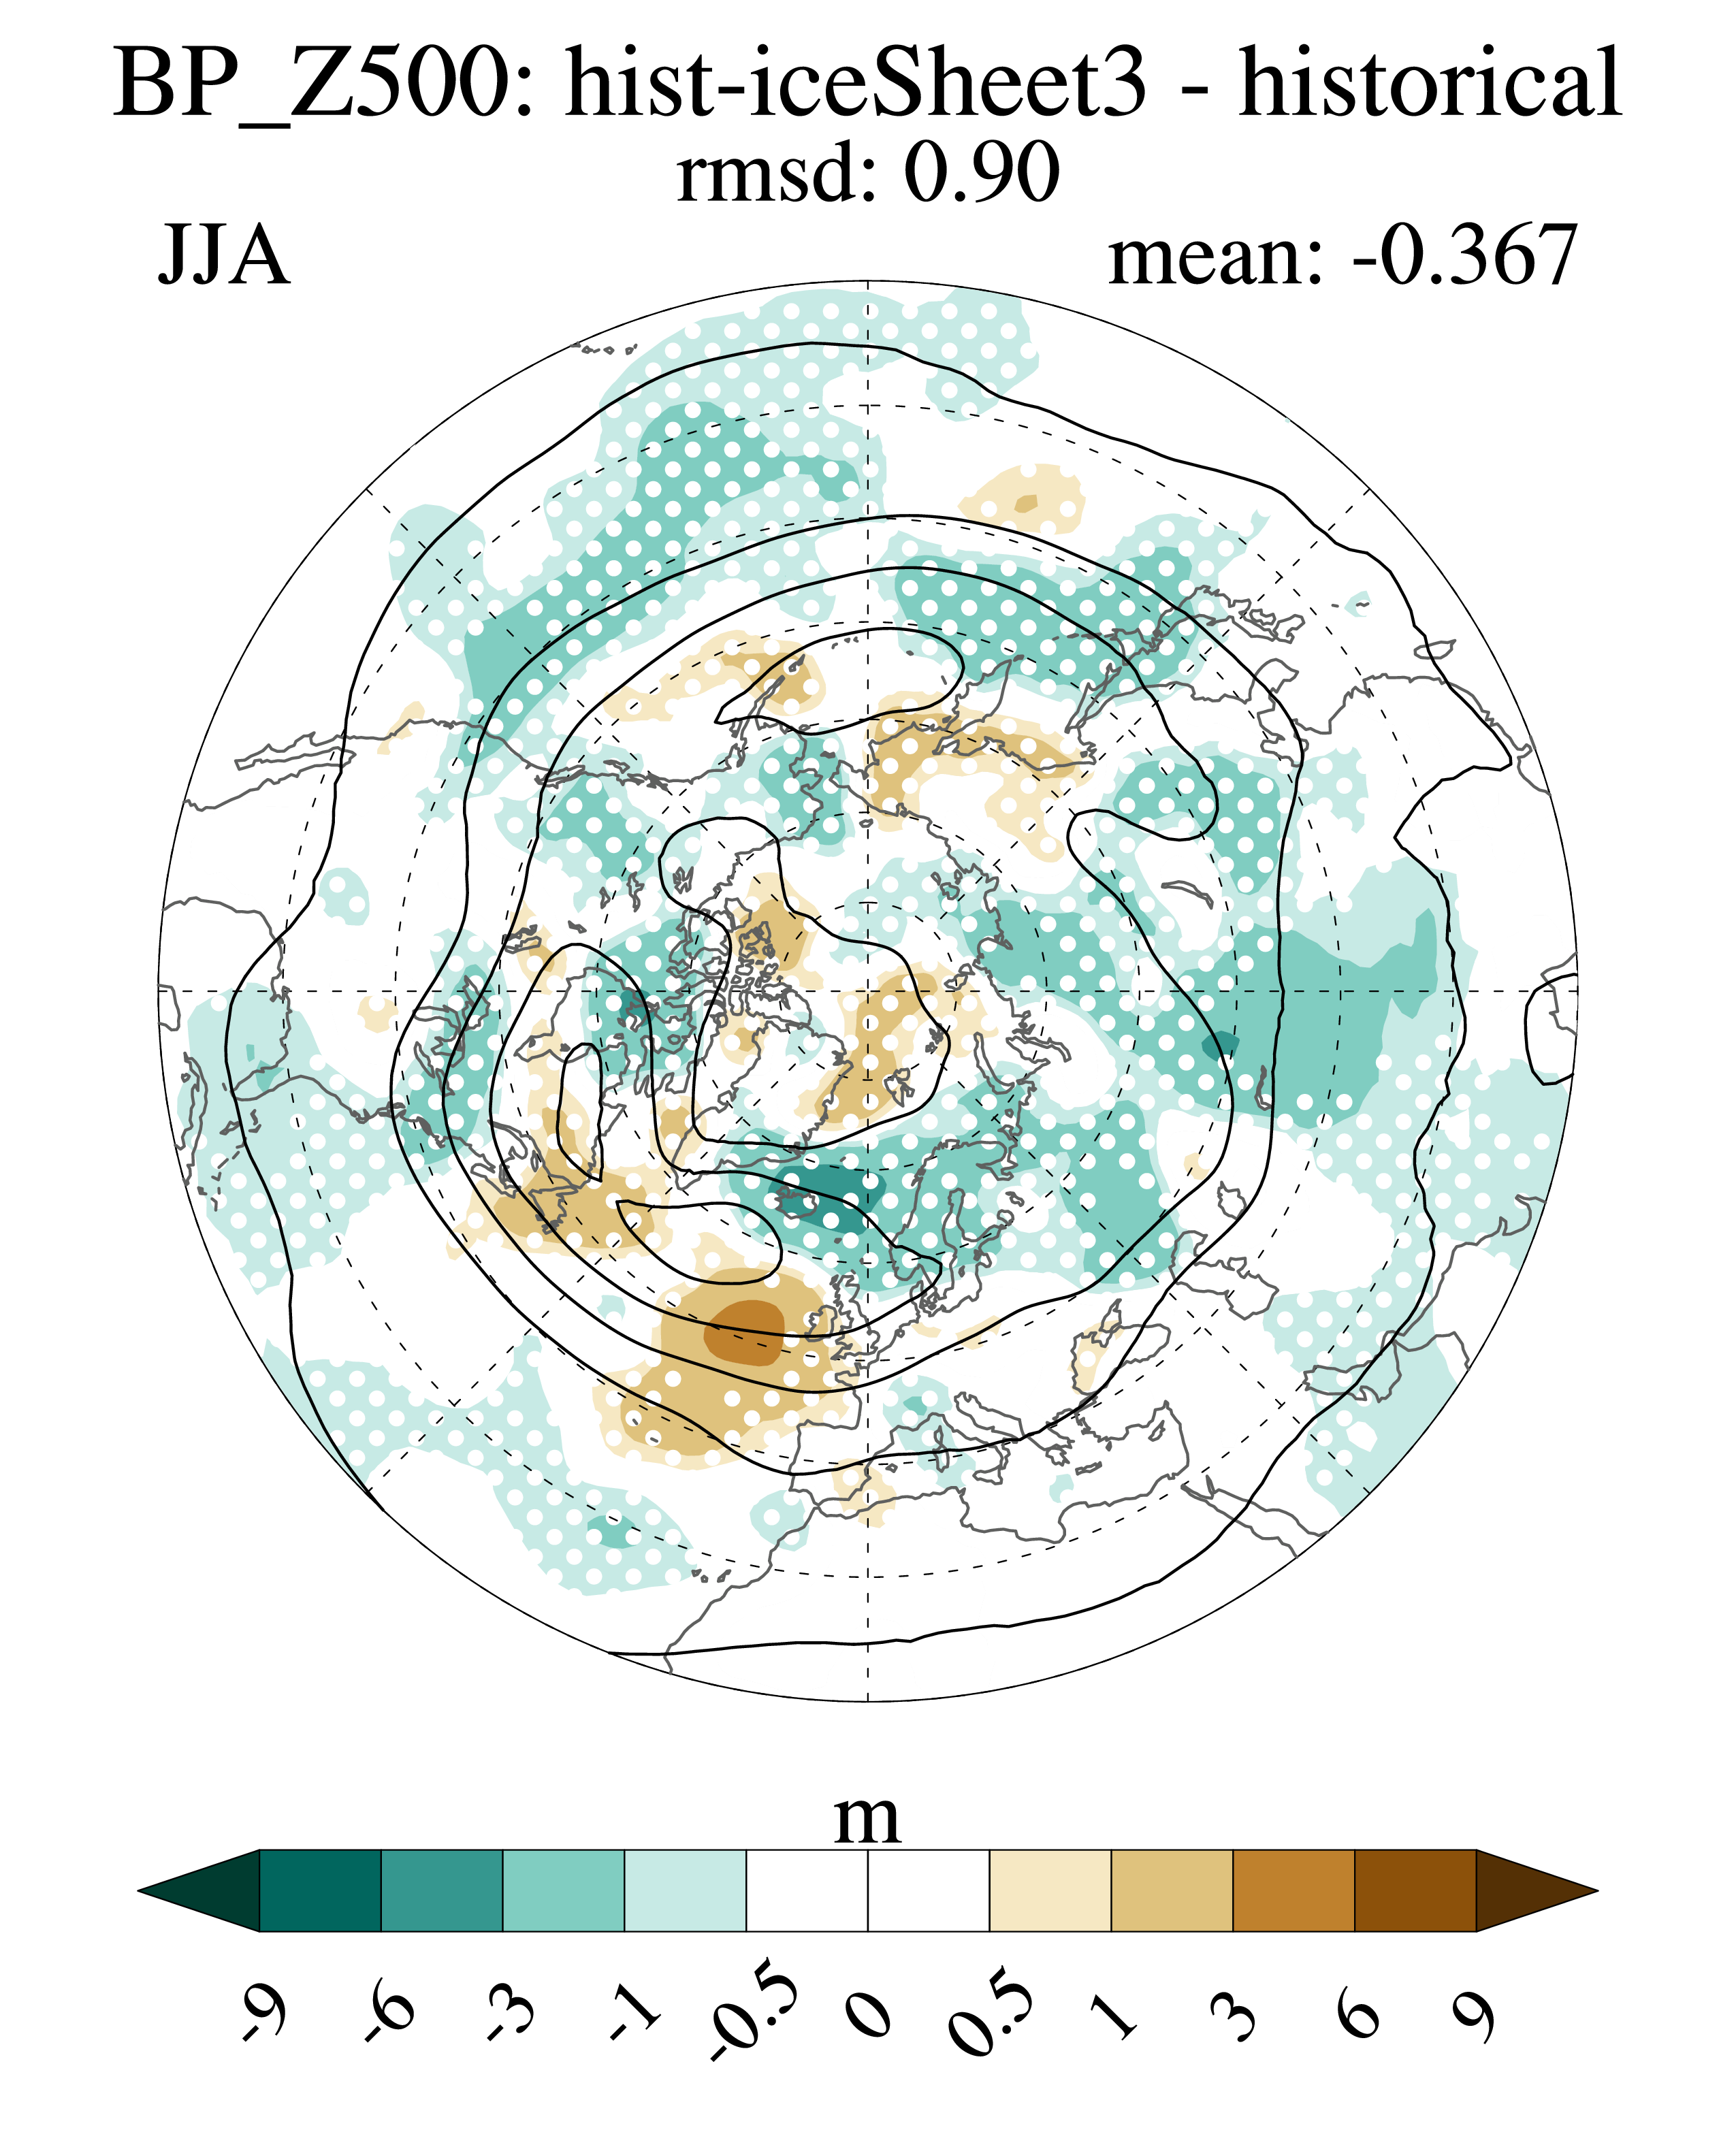
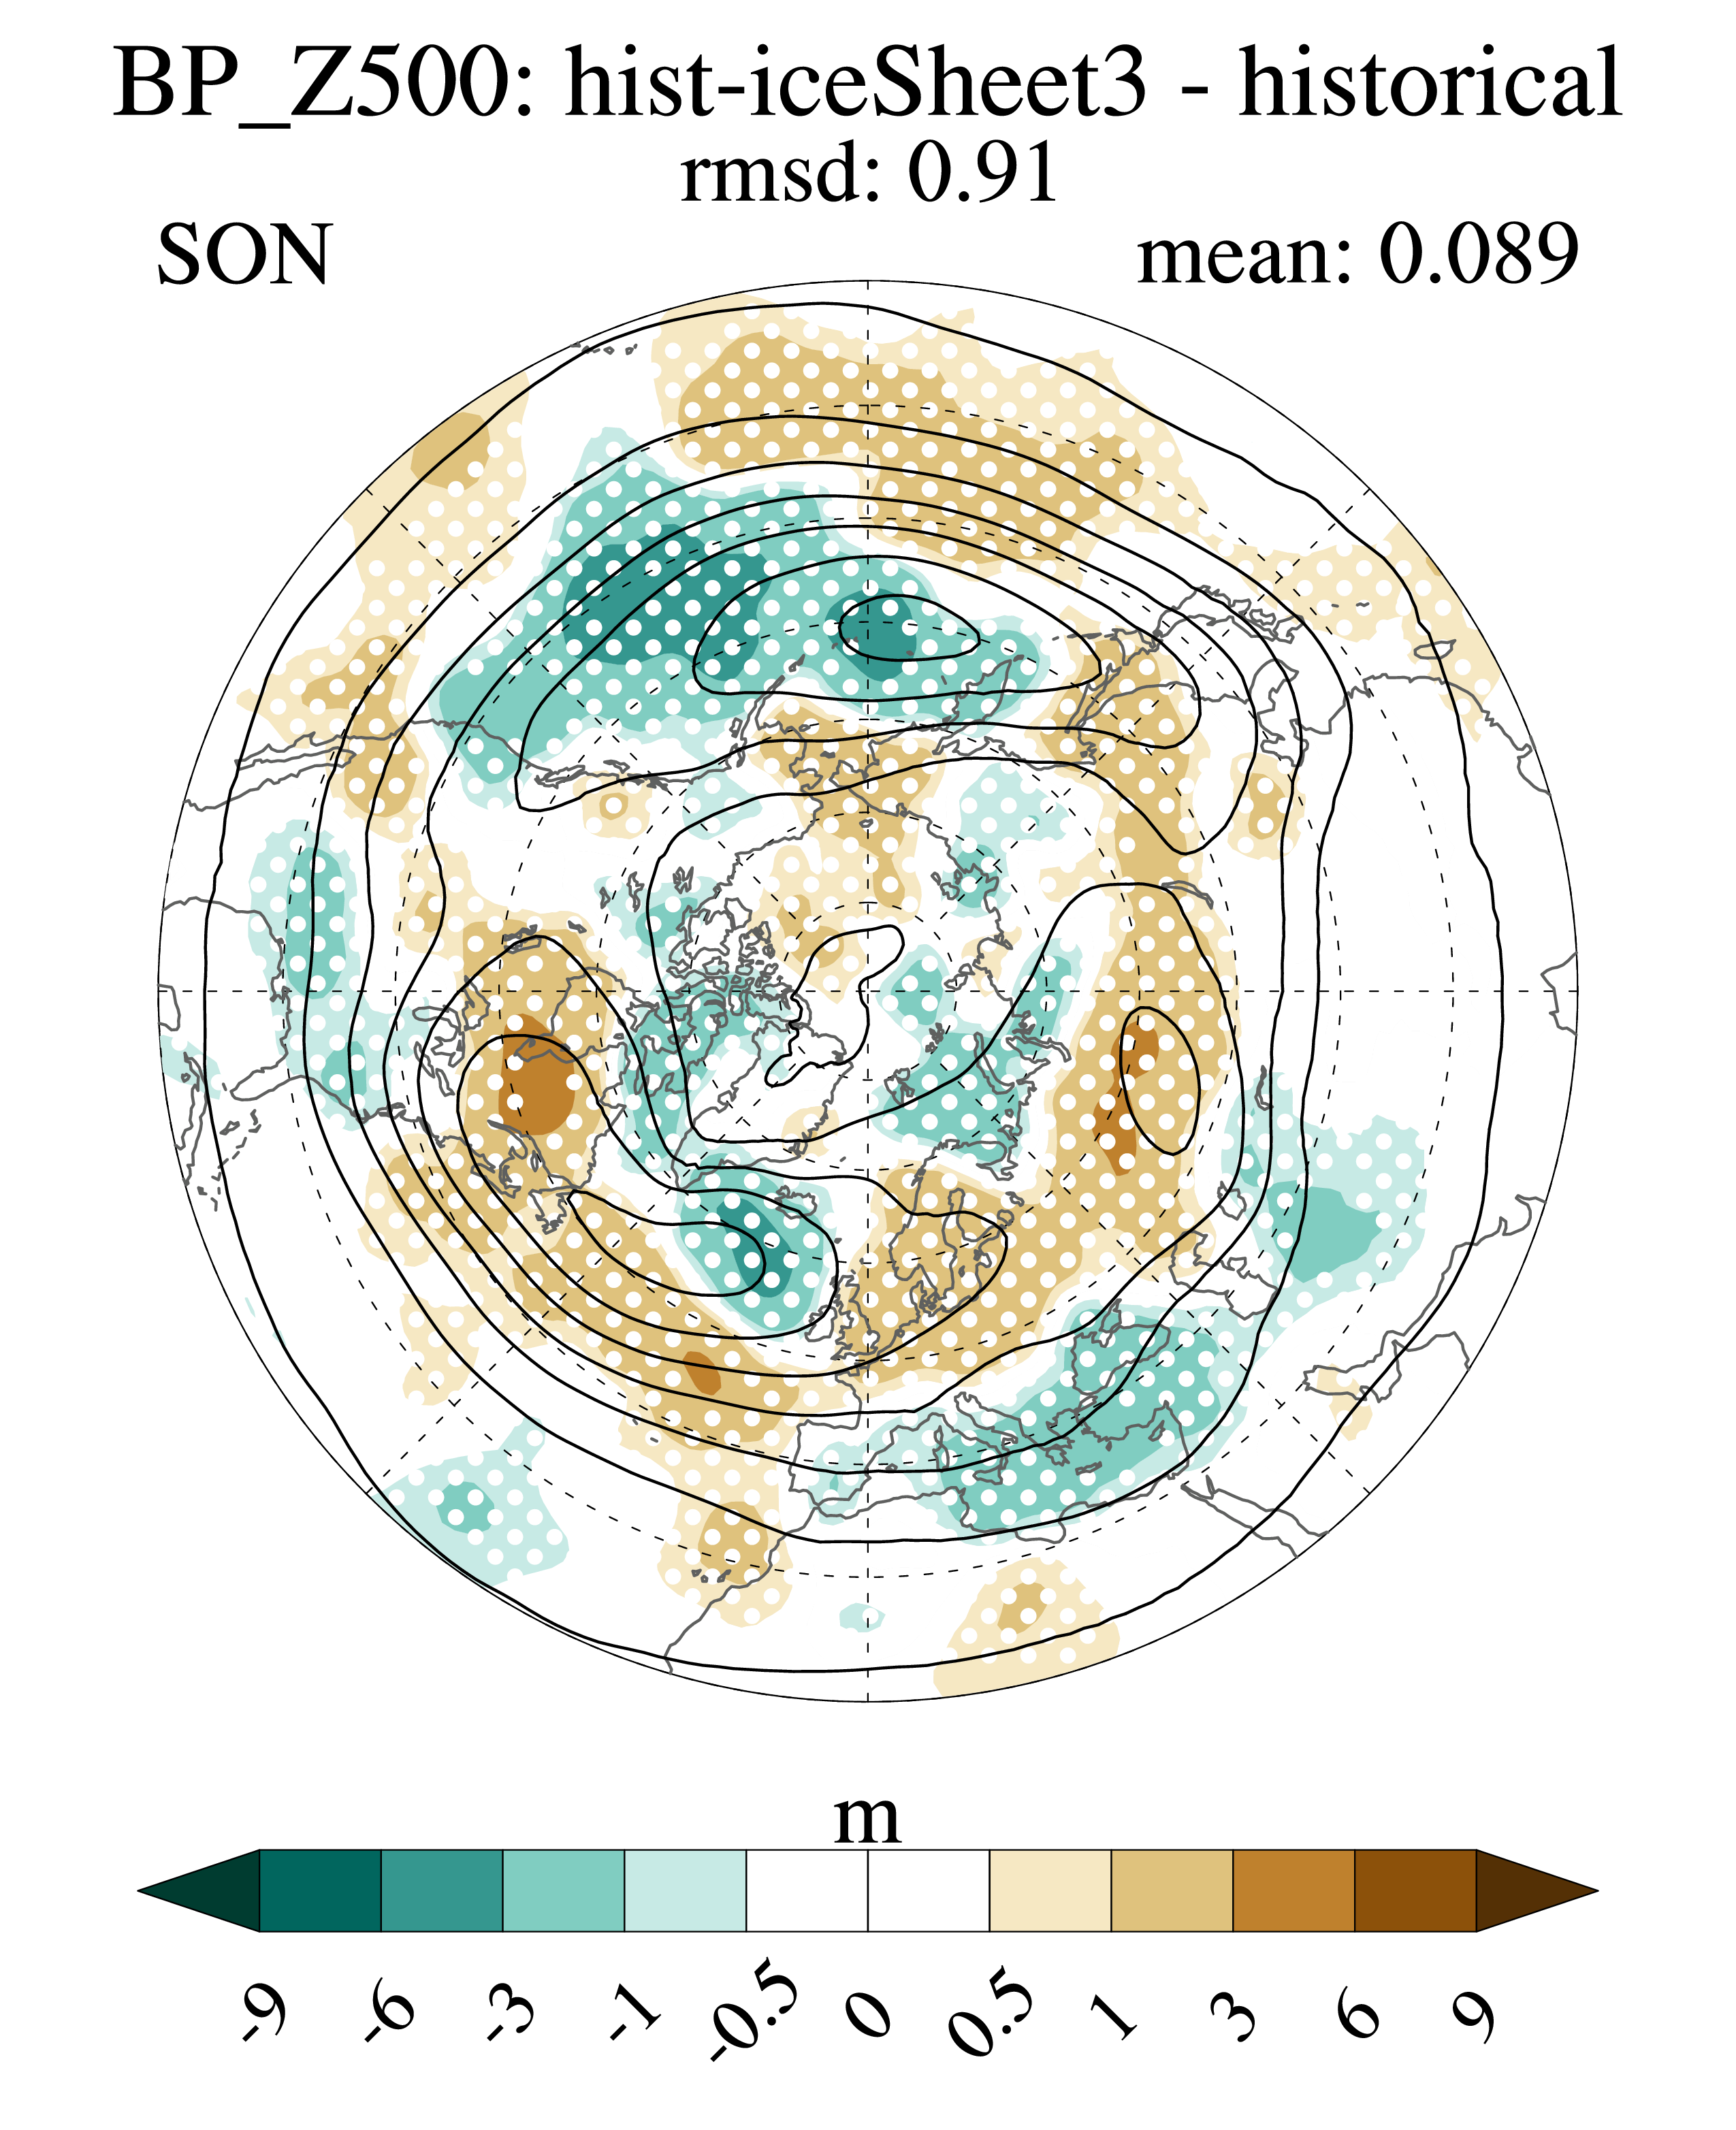
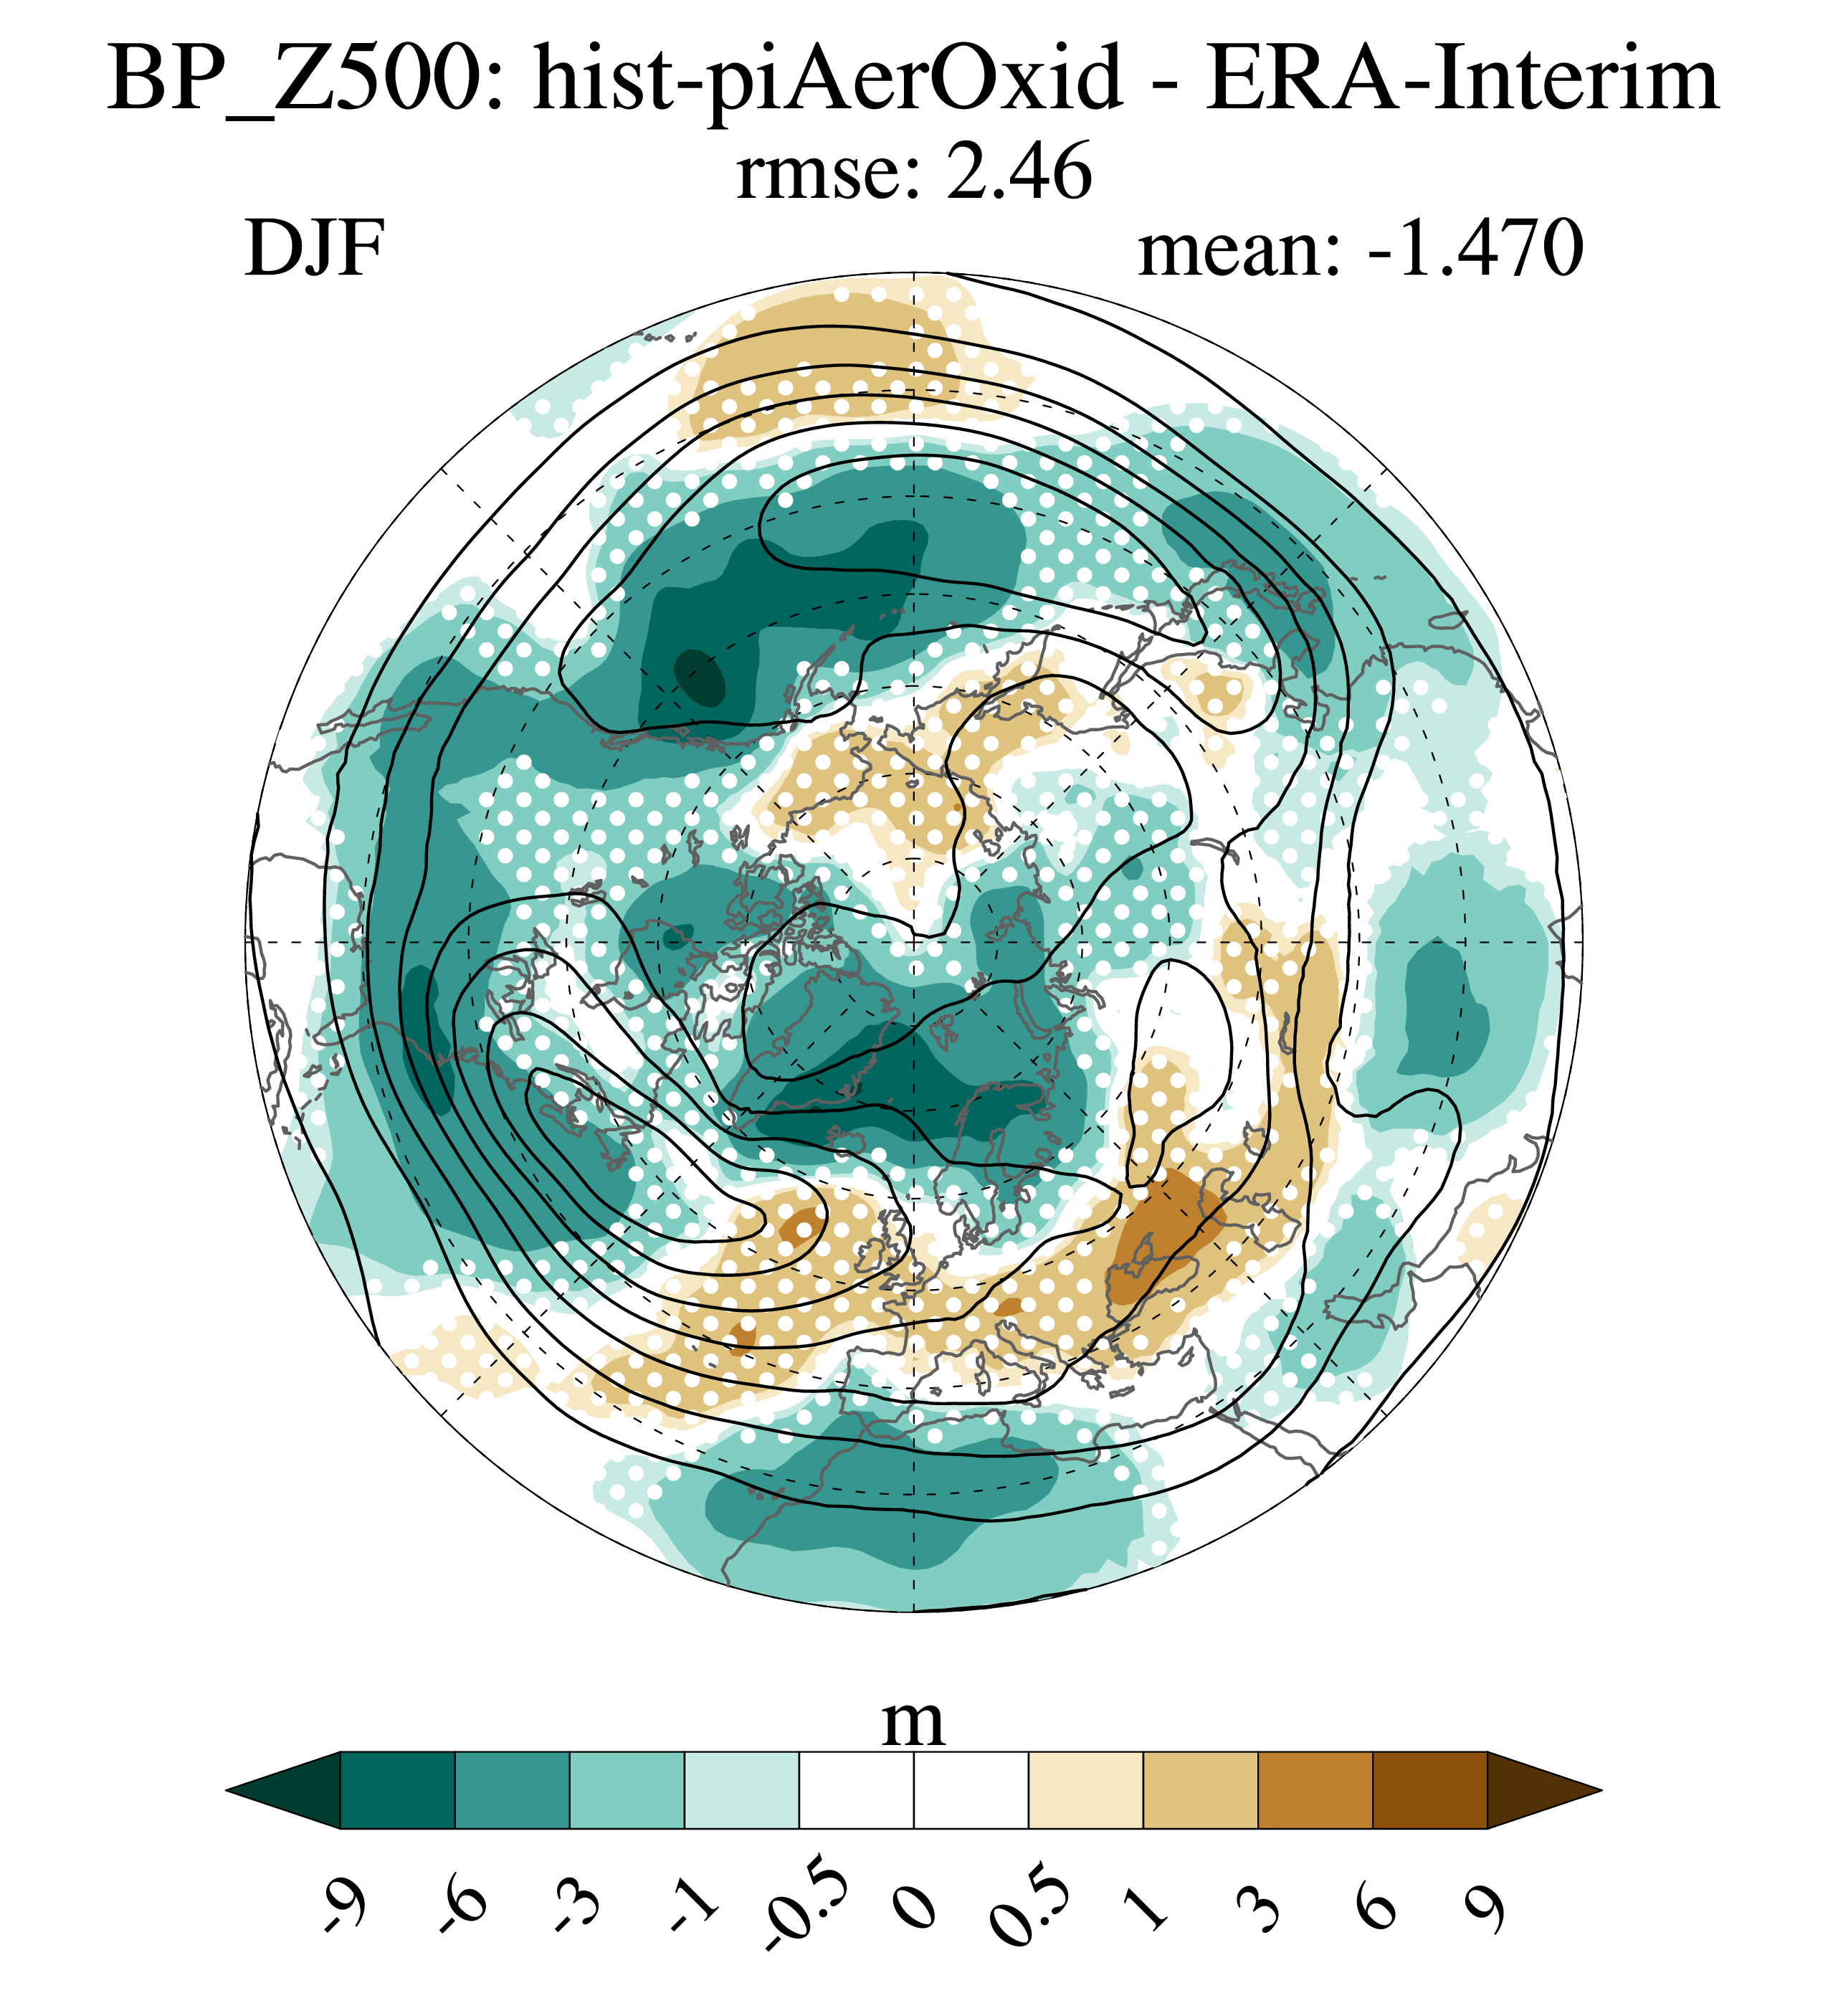
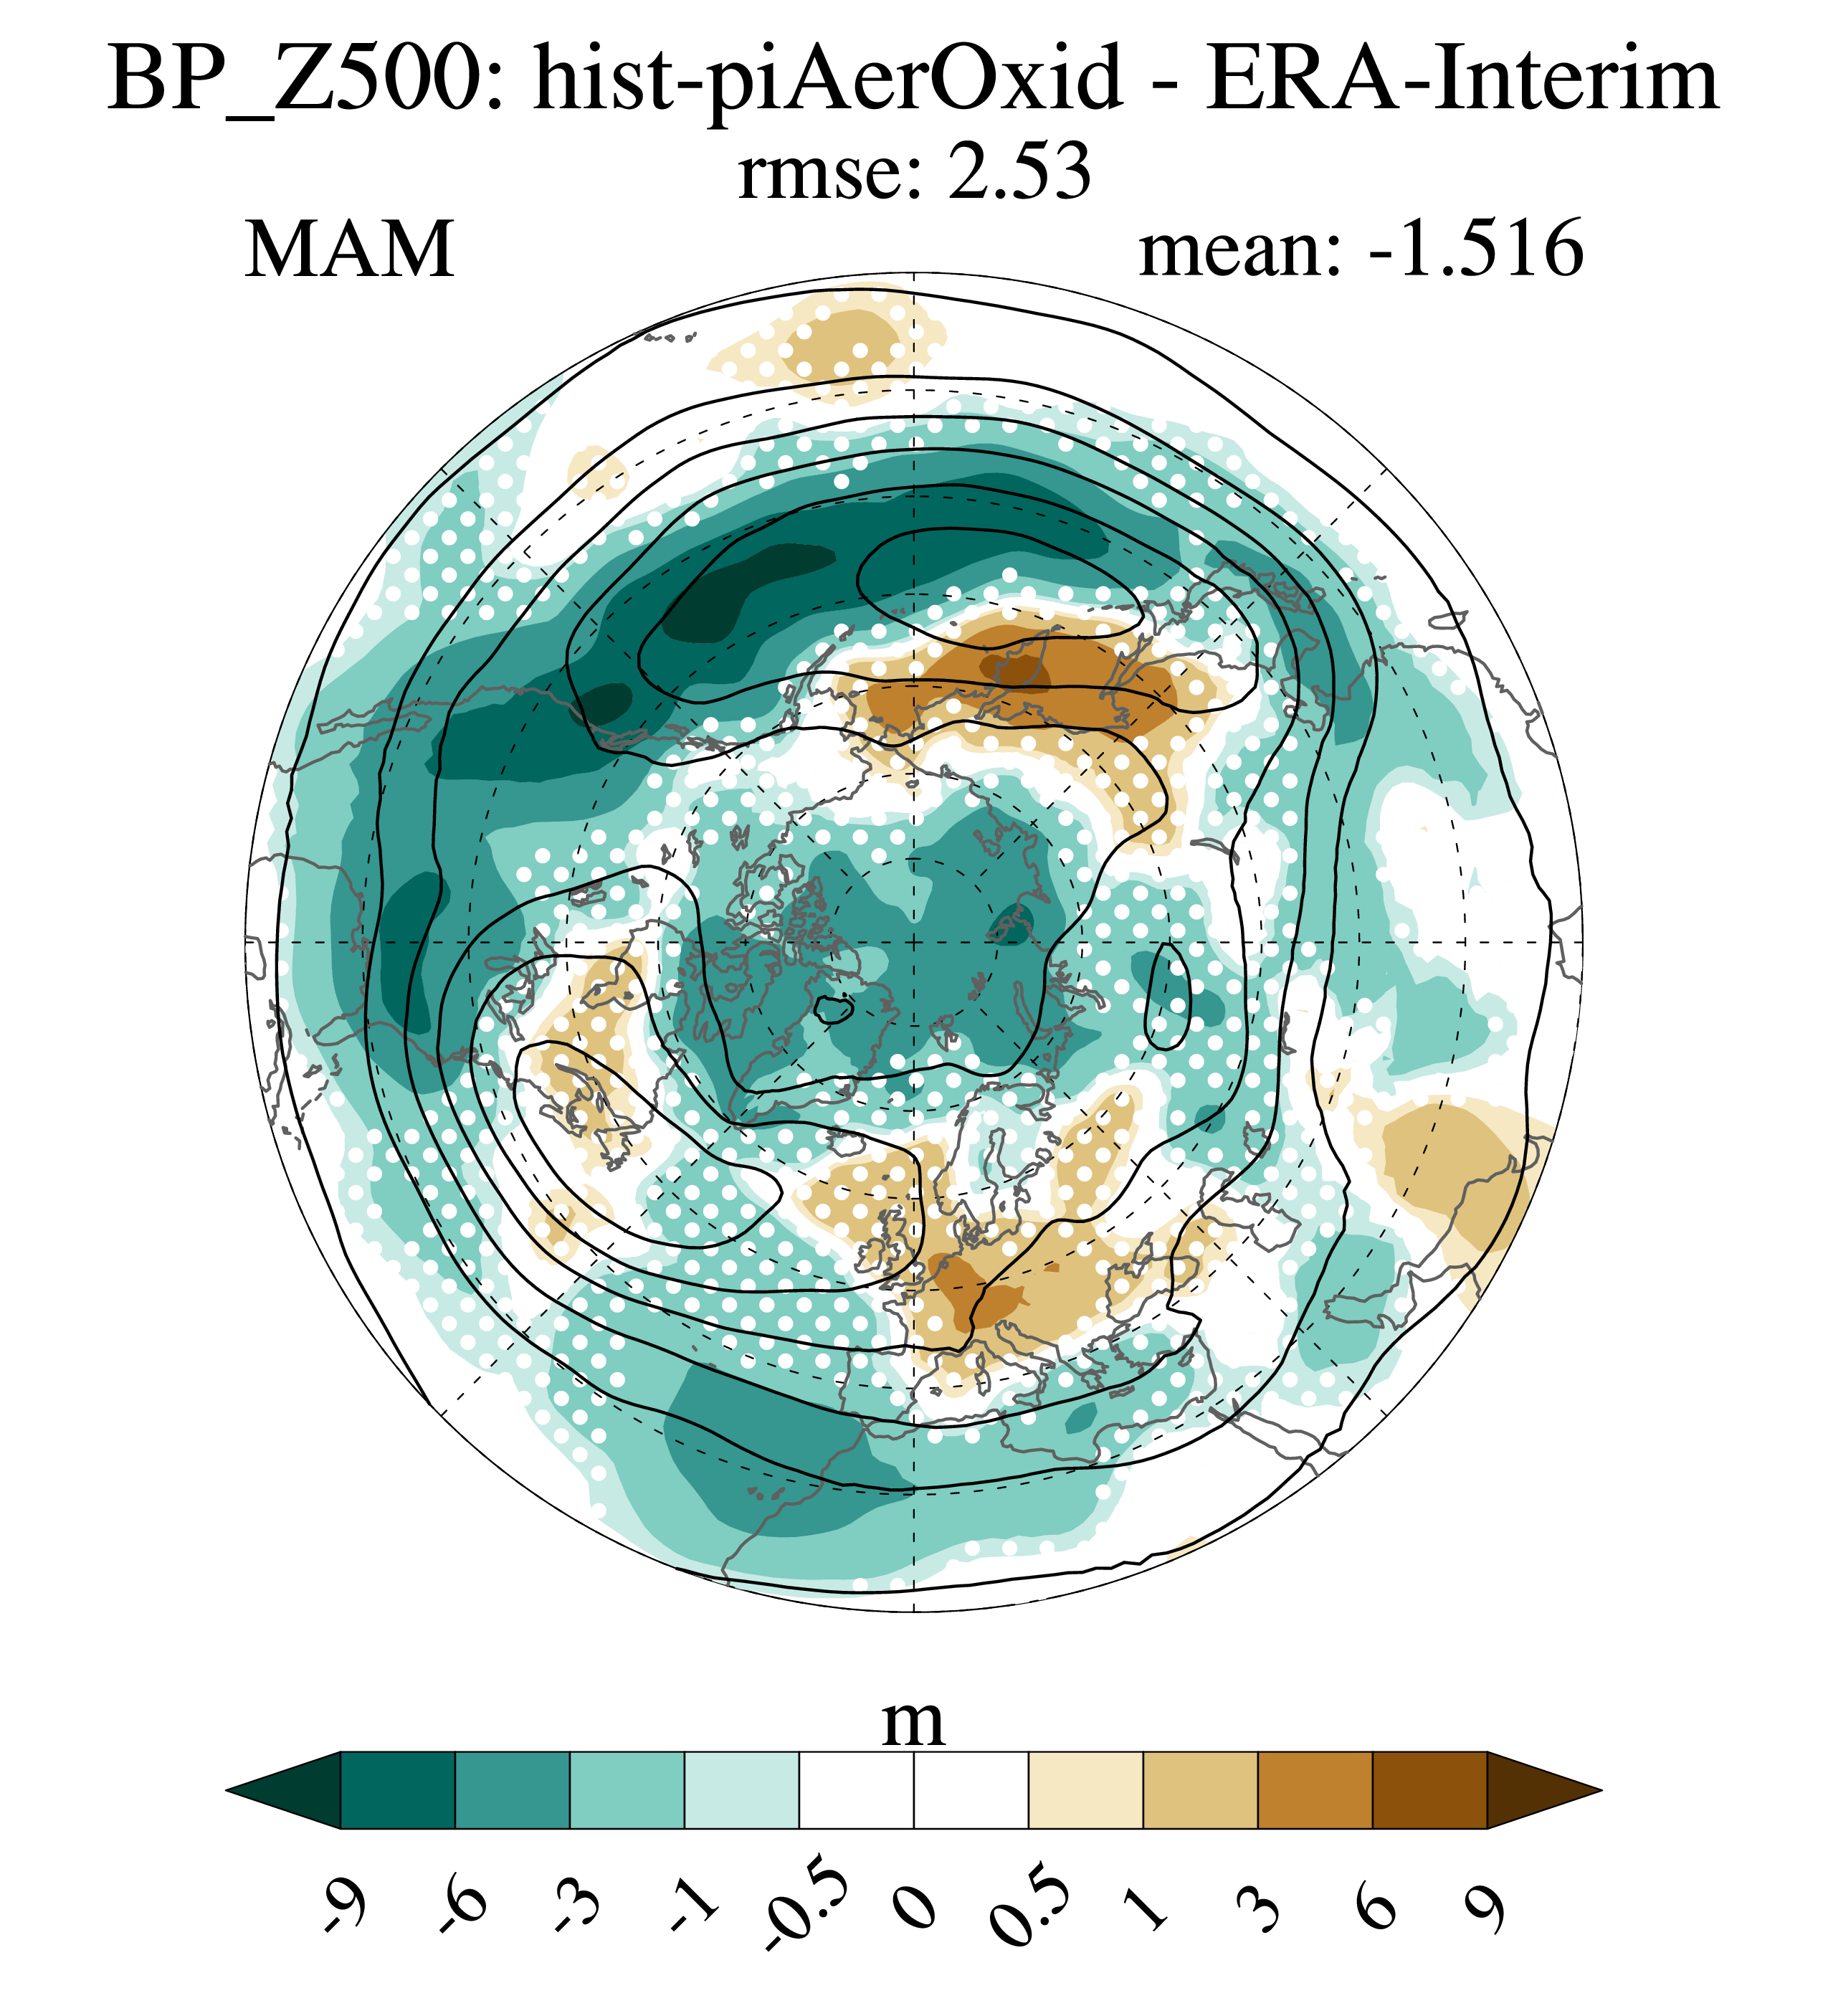
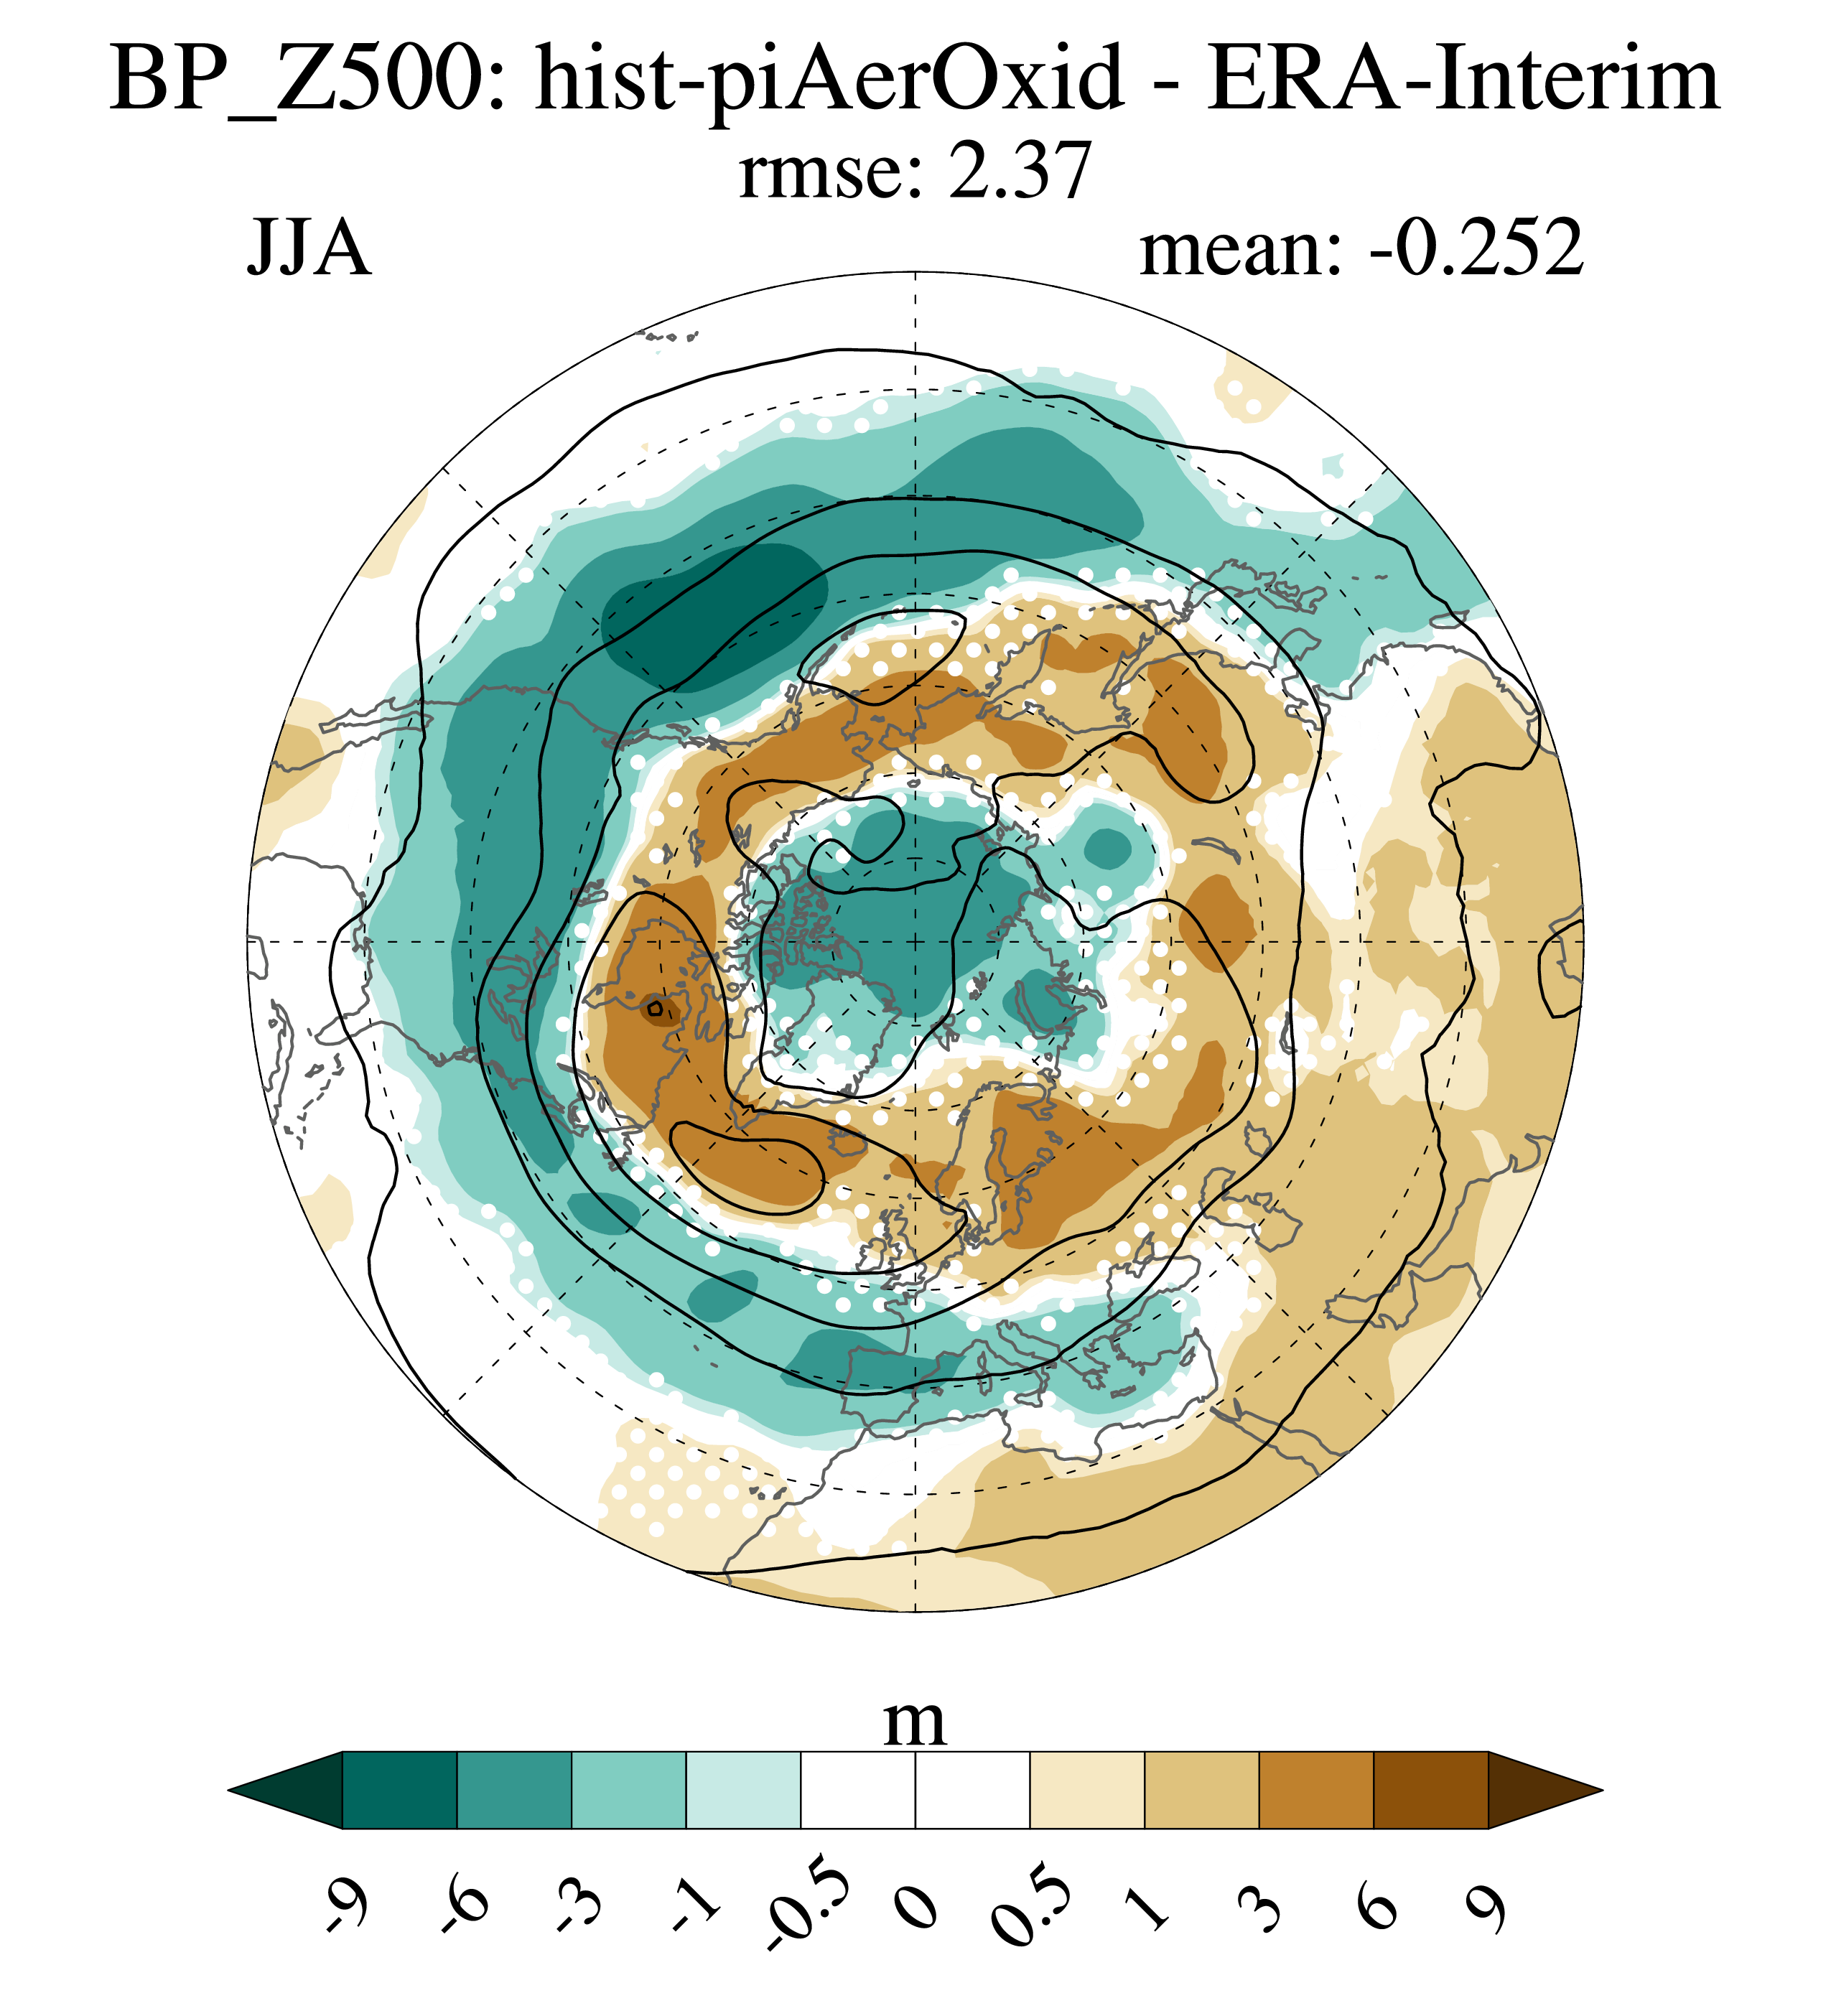
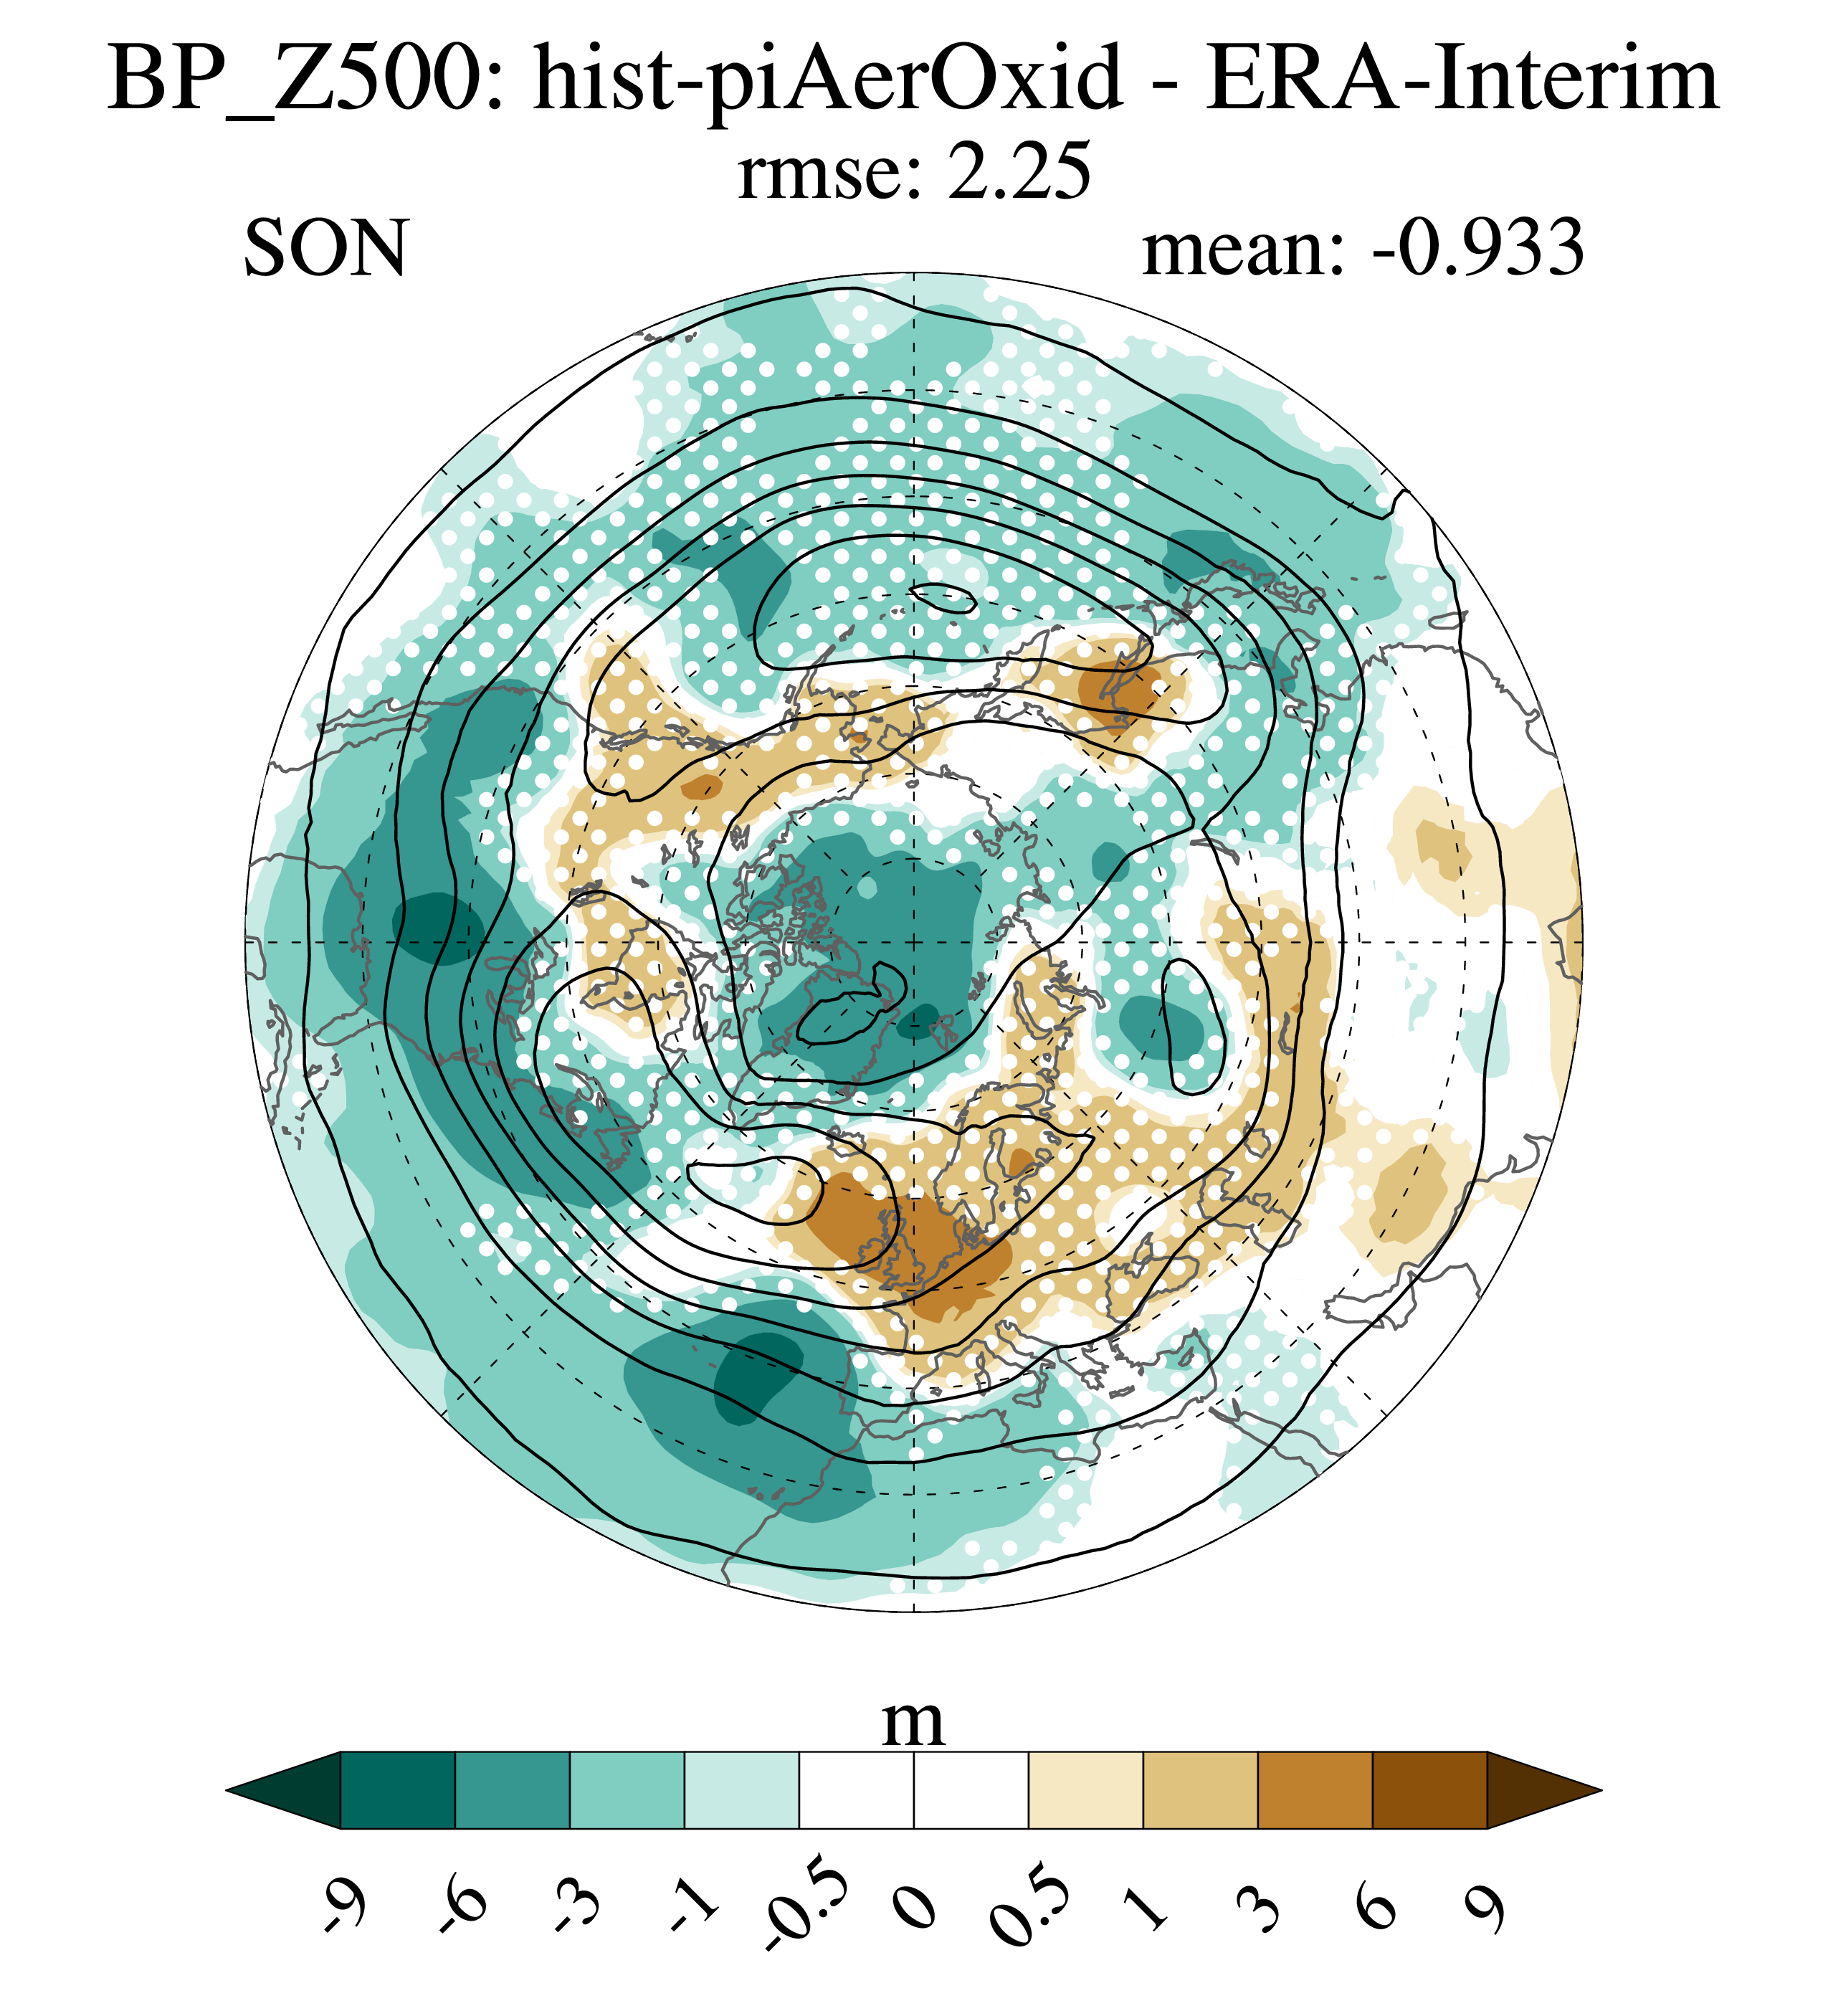
Storm-track activity at 500 hPa
The storm-track activity is represented in terms of the sub-weekly
fluctuations in the geopotential height field at 500 hPa (Z500). The
Z500 field was bandpass (BP) filtered retaining frequencies
corresponding to 2.5-6 days and the plots show the standard deviation
of the bandpass-filtered field.
DJF (column 1), MAM (column 2), JJA (column 3), SON (column 4)
CMIP6 historical
historical (1985-2014) - ERA-Interim (1985-2014)
historical2 (1985-2014) - historical1 (1985-2014)
historical3 (1985-2014) - historical1 (1985-2014)
KeyCLIM hist-cloud
hist-cloud (1985-2014) - ERA-Interim (1985-2014)
hist-cloud (1985-2014) - historical (1985-2014)
KeyCLIM hist-cloud2
hist-cloud2 (1985-2014) - ERA-Interim (1985-2014)
hist-cloud2 (1985-2014) - historical (1985-2014)
KeyCLIM hist-snow
hist-snow (1985-2014) - ERA-Interim (1985-2014)
hist-snow (1985-2014) - historical (1985-2014)
KeyCLIM hist-iceSheet
Data is missing for this experiment...
hist-iceSheet (1985-2014) - ERA-Interim (1985-2014)


hist-iceSheet (1985-2014) - historical (1985-2014)


KeyCLIM hist-iceSheet2
hist-iceSheet2 (1985-2014) - ERA-Interim (1985-2014)
hist-iceSheet2 (1985-2014) - historical (1985-2014)
KeyCLIM hist-iceSheet3
hist-iceSheet3 (1985-2014) - ERA-Interim (1985-2014)
hist-iceSheet3 (1985-2014) - historical (1985-2014)
KeyCLIM hist-piAerOxid
hist-piAerOxid (1985-2014) - ERA-Interim (1985-2014)
hist-piAerOxid (1985-2014) - historical (1985-2014)